SOFTWARE
FILOS
-
Filtration Data Analysis with Protocol and Report
For Cake Formation and the optional steps: Cake Washing, Cake Squeezing, Cake Deliquoring. Data correction and reliabe Determination of all efficiency parameters needed for the calculation of Filter Performance
-
Filter Design, Calculation of Filter Performance and Optimization
of all important and widely used Filter Apparatuses: Belt Filters, Drum Filters, Disc Filters, Pan Filters, Nutsche Filters, Candle Filters, Pressure Leaf Filters, Filter Presses and Filter Press Automats
-
Database
with tables and graphs including all test data and analysis results as well as all filter simulation results
Filter Simulation window for Continuous Filters – Example: Simulation of a Belt Filter with Reversible Trays
Tables & Charts window for Continuous Filters
Filter Simulation window for Batch Filters – Example: Simulation of a Membrane Filter Press
Filter Simulation window for Batch Filters – Example: Simulation of a Pressure Nutsche
Tables & Charts window for Batch Filters
FILOS Comparison window for Filter Simulations
Create New Simulation Window (left) with loading of Default Material Data for the New Simulation (right)
FILOS- Protocol window – Example of an Experiment with Cake Formation, Washing, Squeezing and Deliquoring
FILOS- Report window
Start Window of the FILOS Detailed Cake Formation Module
Analysis Window of the FILOS Detailed Cake Formation Module
Data Input Window of the FILOS - Cake Deliquoring module
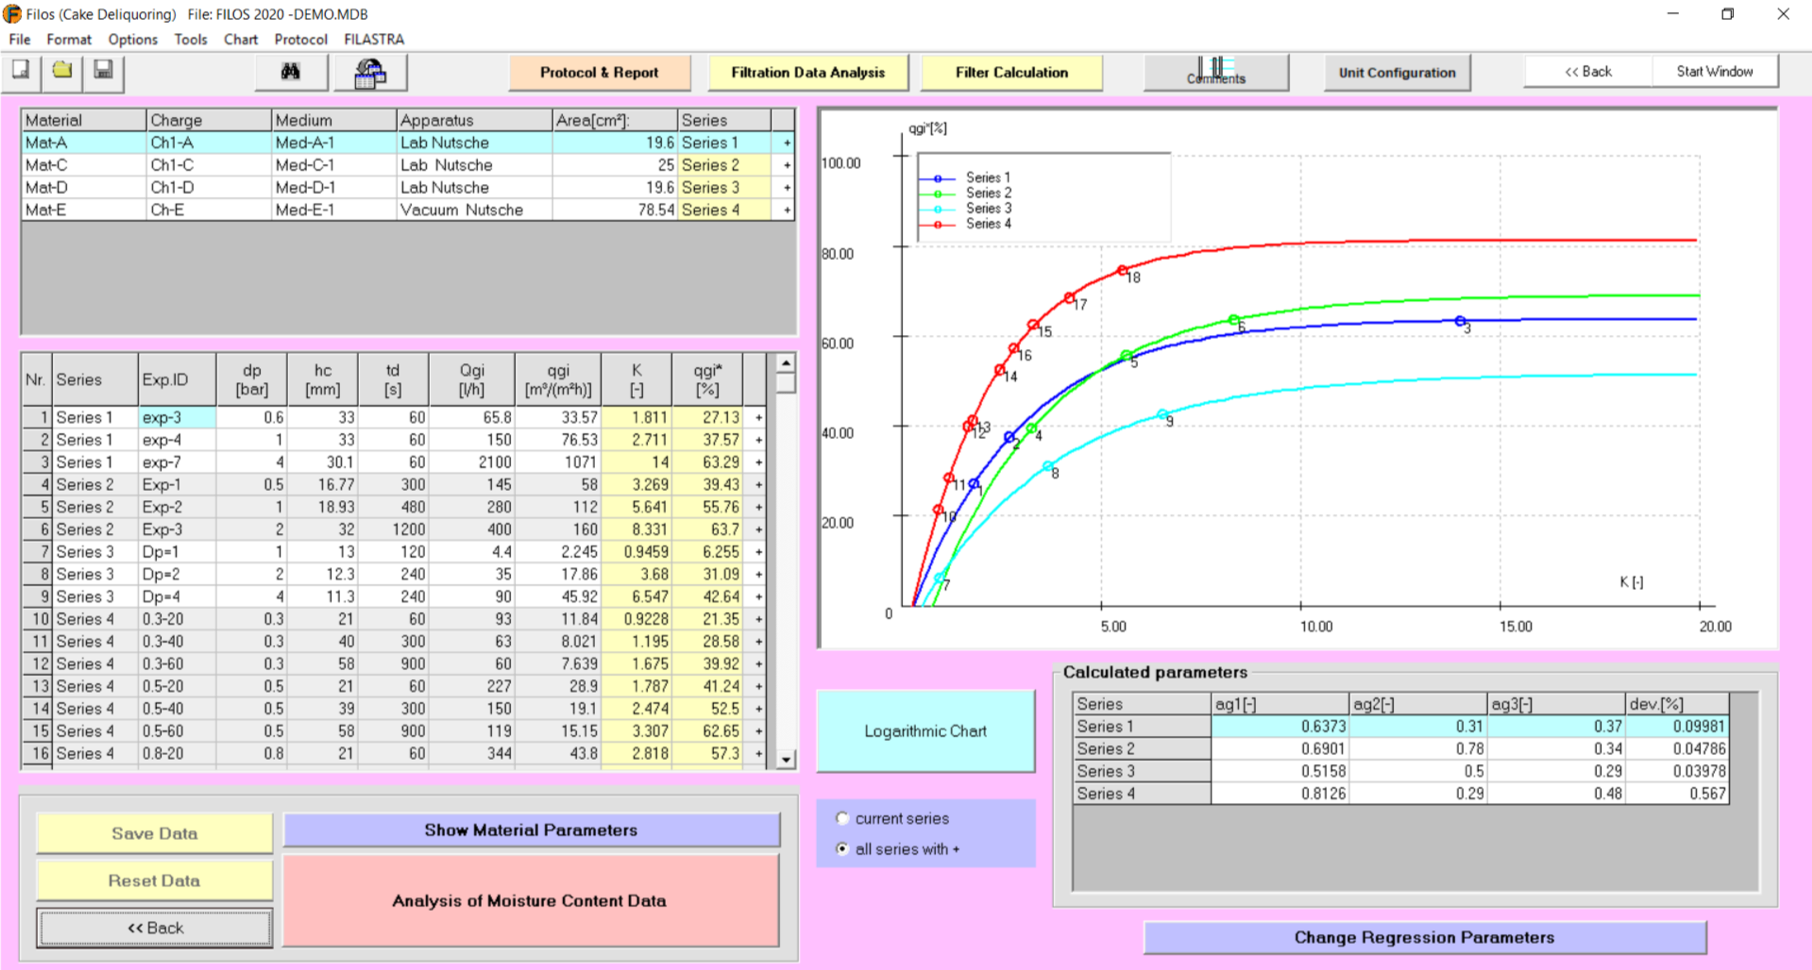
Analysis window of the FILOS -Cake Deliquoring module (Analysis of cake Moisture content)
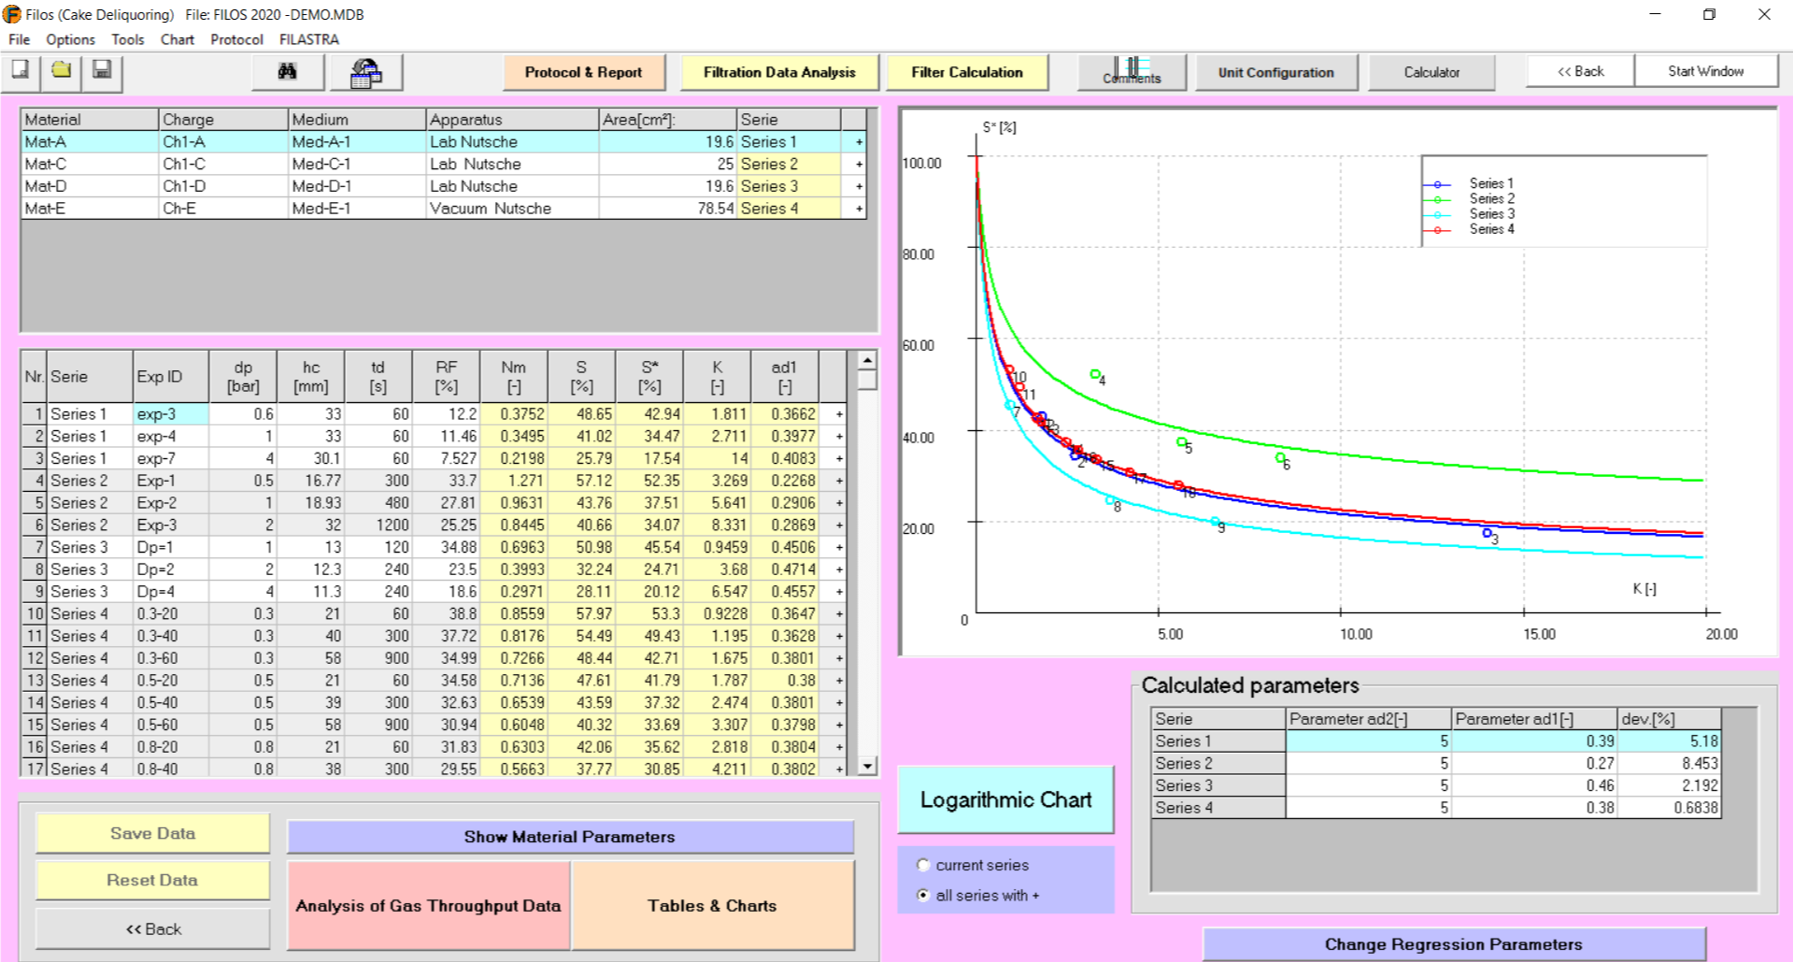
Analysis window of the FILOS -Cake Deliquoring module (Analysis of Gas Flow Rate)
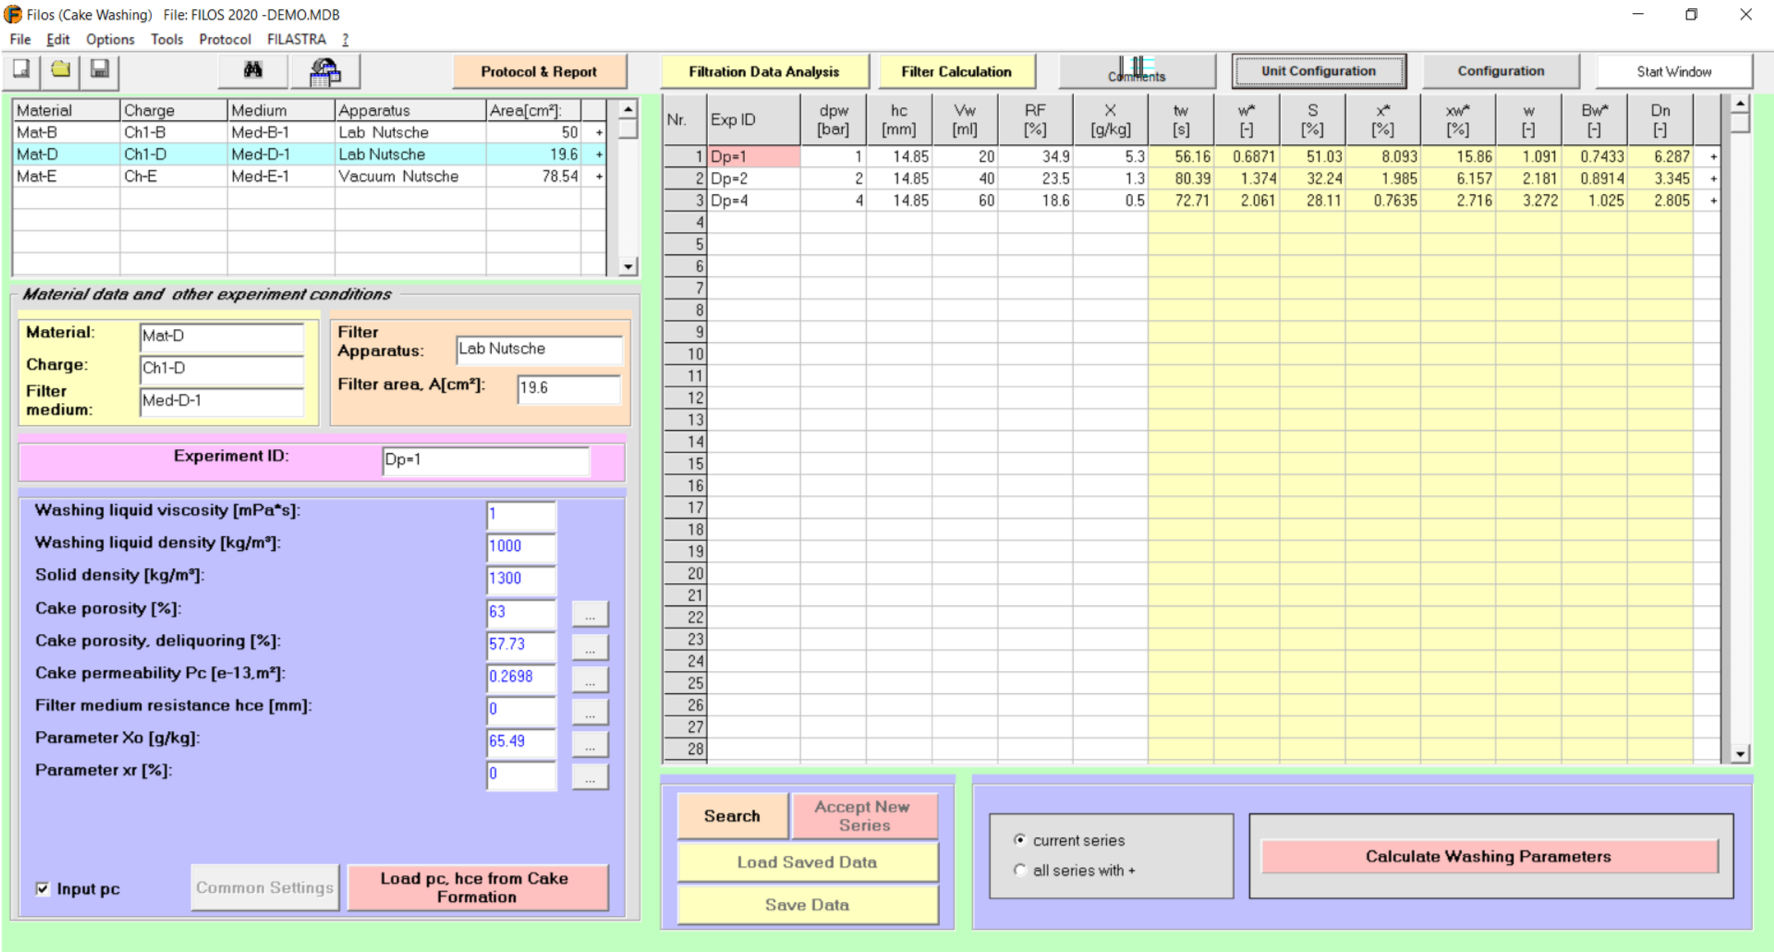
Data Input window of the FILOS module Cake Washing
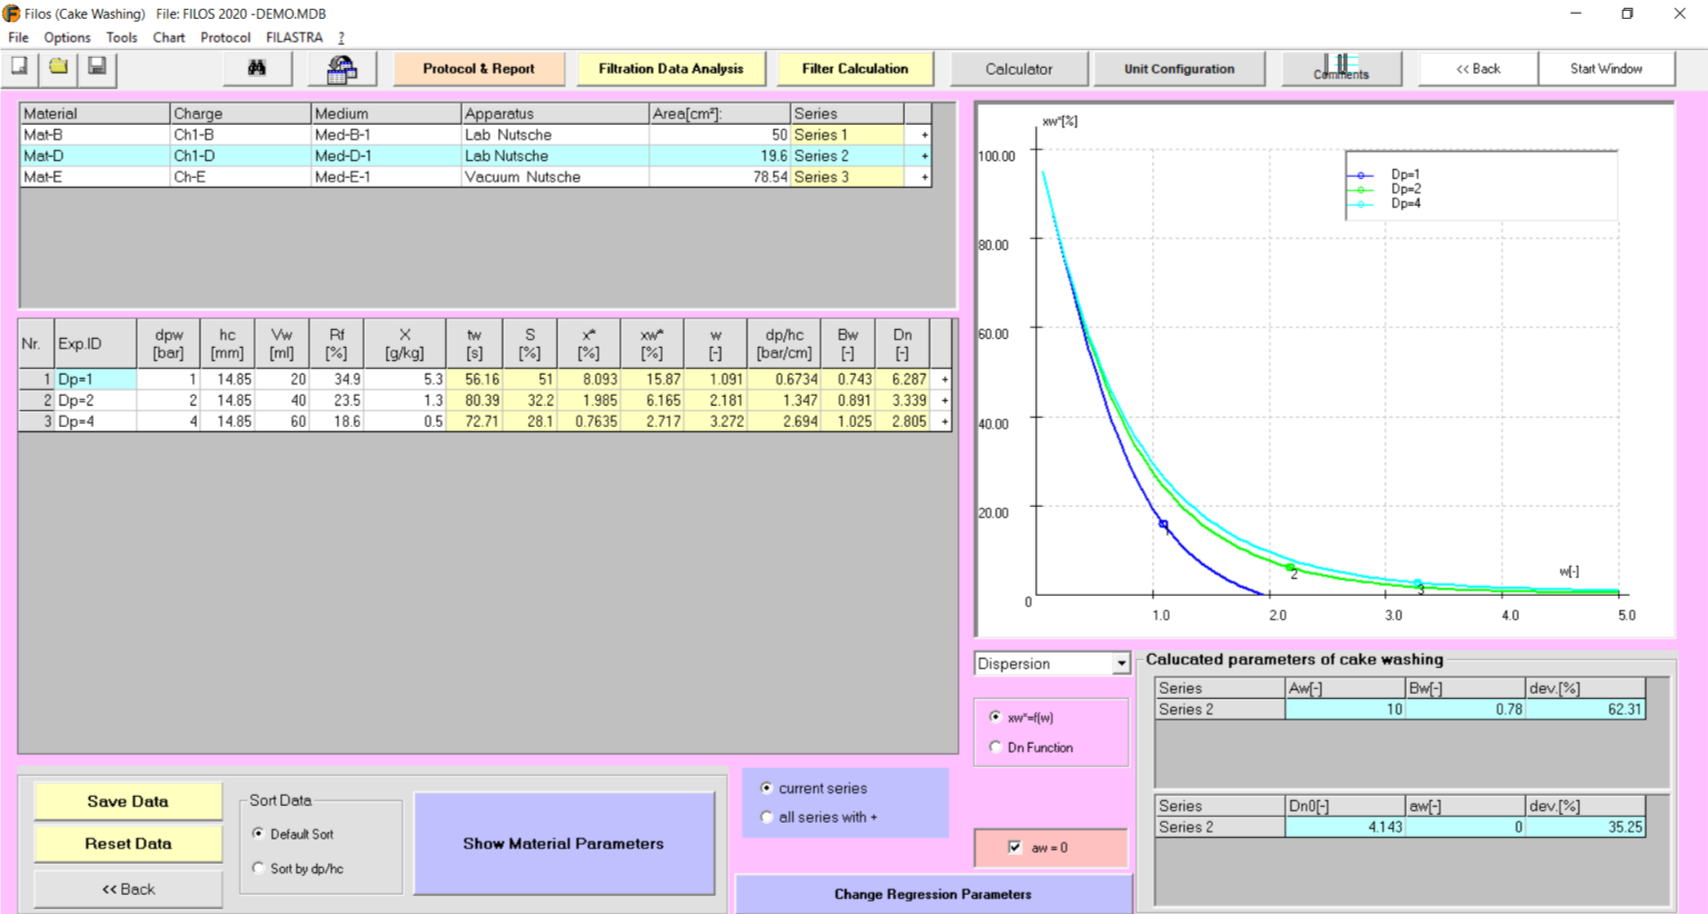
Analysis window of the FILOS module Cake Washing
Data Input window of the FILOS module Cake Squeezing
Analysis window of the FILOS module Cake Squeezing
1/18
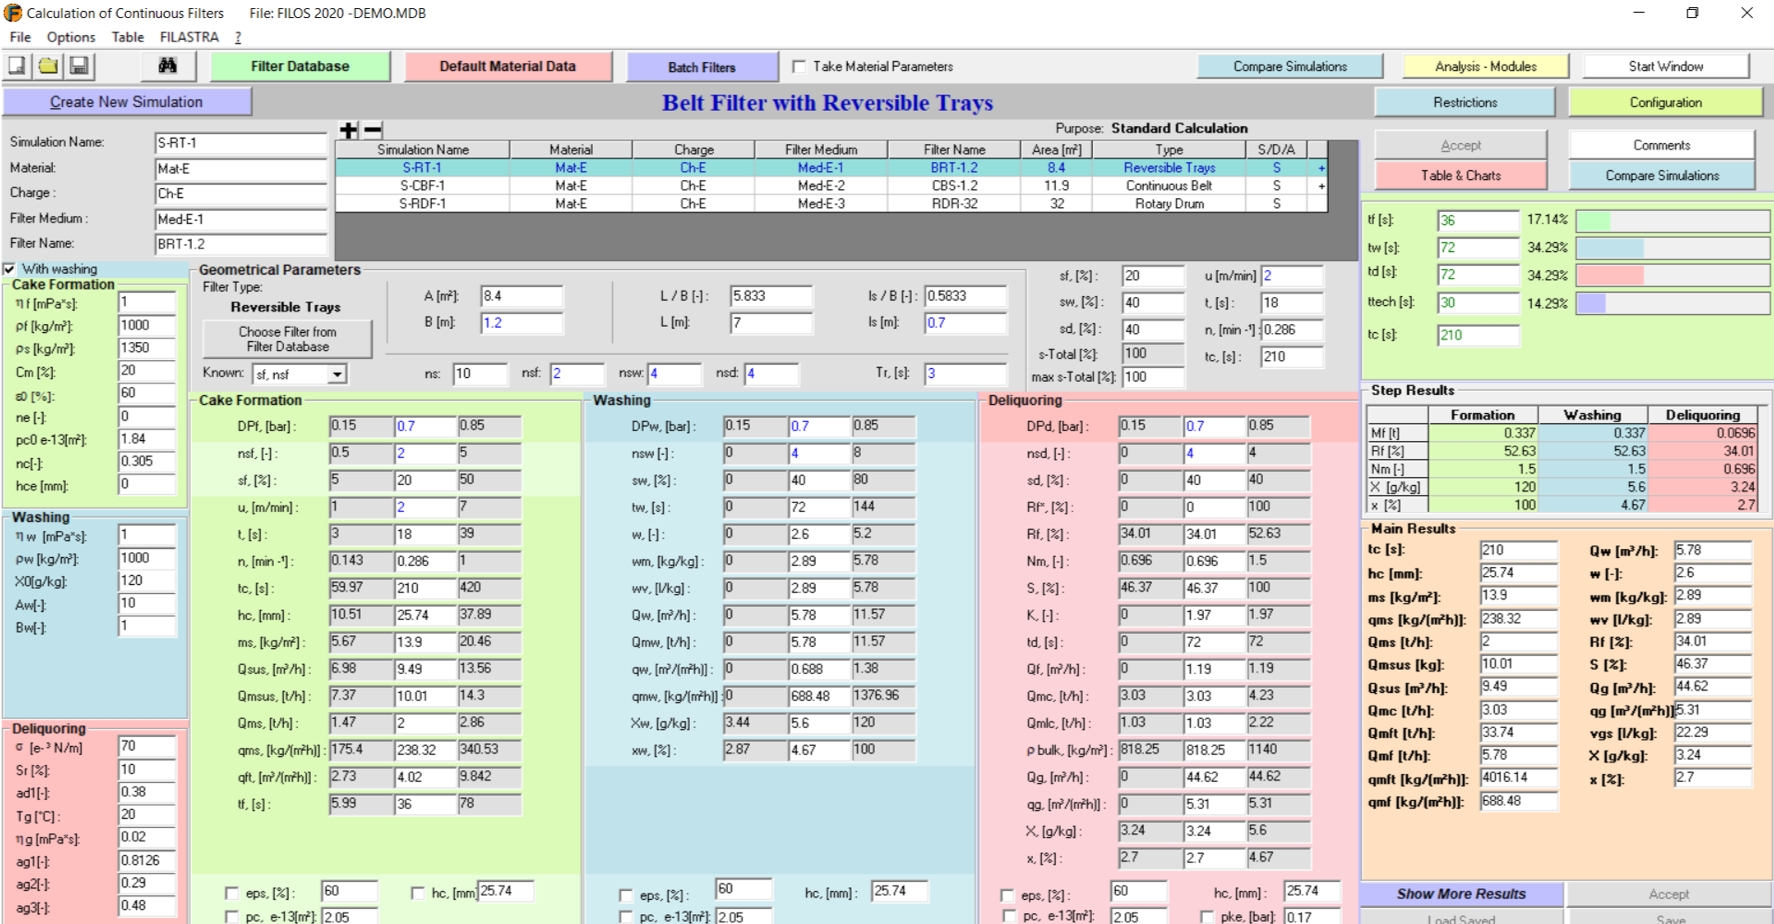
Filter Simulation window for Continuous Filters – Example: Simulation of a Belt Filter with Reversible Trays
Filter Simulation window for Continuous Filters – Example: Simulation of a Belt Filter with Reversible Trays
FILOS Simulation Window for Vacuum and Pressure Continuous Filters: Belt, Drum, Disc, Pan Filters. In this window we see a simulation for a Belt Filter with Reversible Trays. Simulations with different filter types are listed together and can be easily compared (see Tables & Charts and Compare Simulations modules). Every Step: Cake Formation, Cake Washing, Cake Deliquoring has its own Column. Highest Flexibility regarding input and calculated parameters. Material Parameters can be automatically loaded from the Data Analysis- module or Default Data can be loaded. Filter geometrical Data are saved in a Database and can be loaded to the Simulation window. Listing of the main results with graphical display of the cycle time components.
2/18
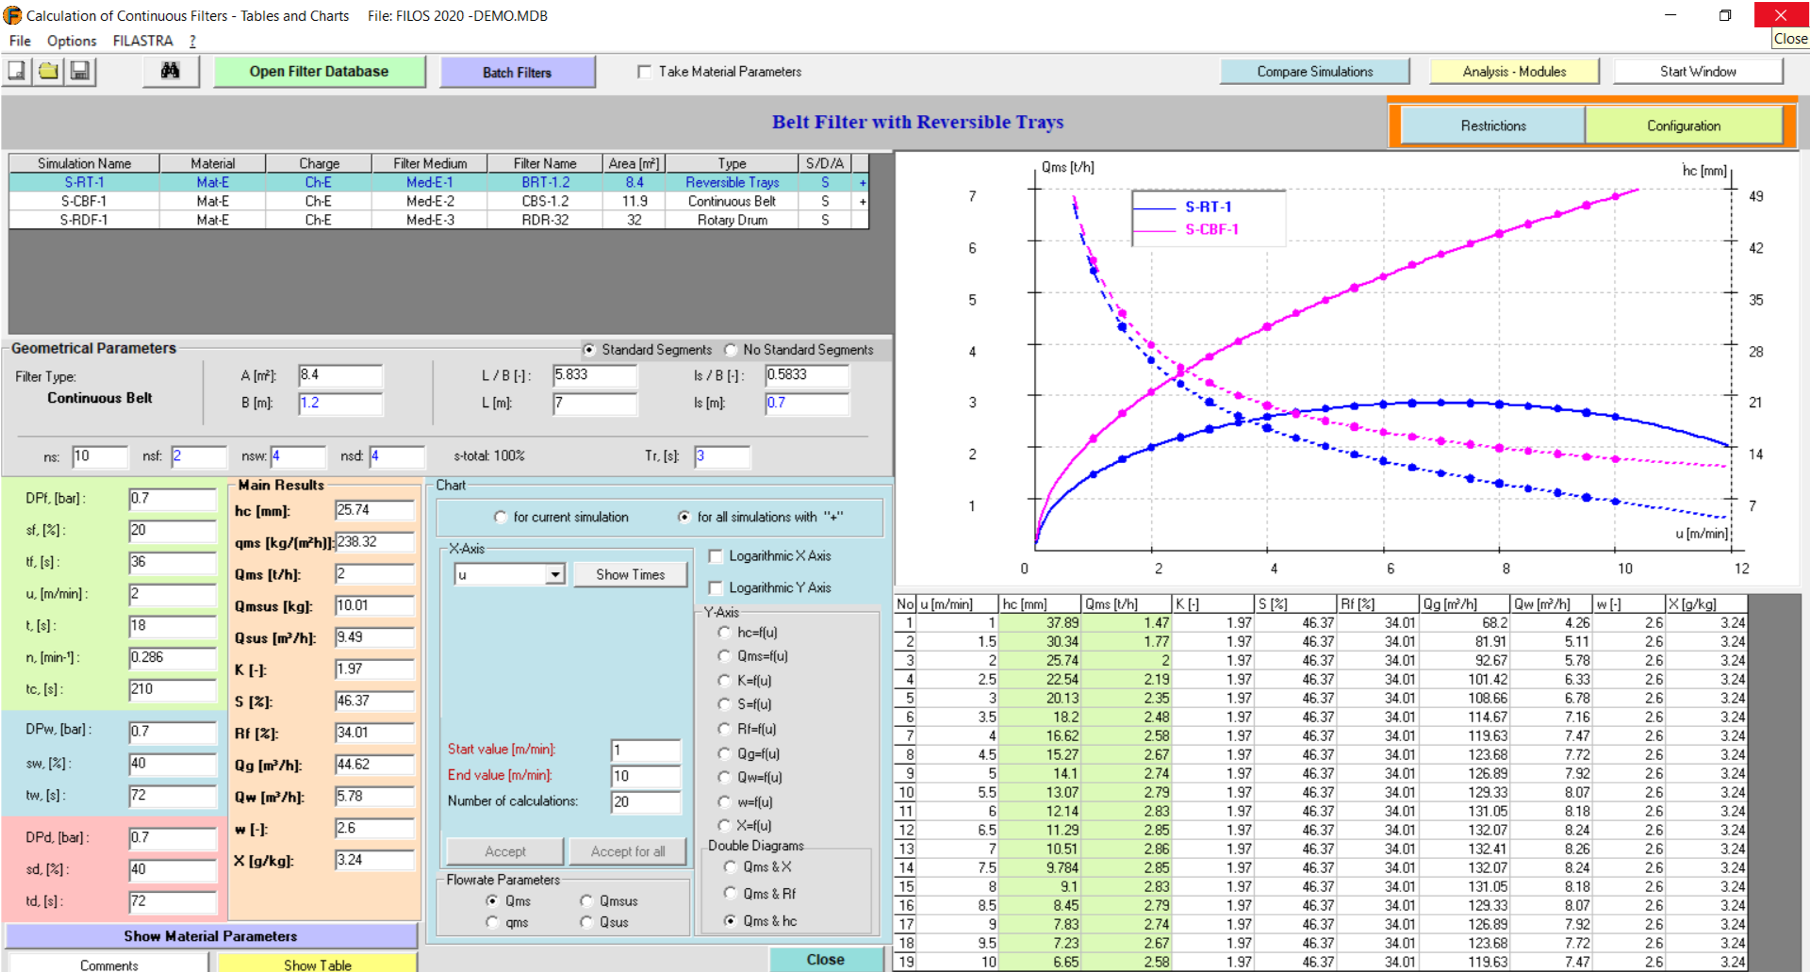
Tables & Charts window for Continuous Filters
Tables & Charts window for Continuous Filters
Powerful Tables & Charts window for Continuous Filters. The influence of the most important geometrical and setting parameters on the filter performance parameters can be displayed in form of tables and graphs. Performance comparisons for different filter types, different materials and different filter settings. All Tables and diagrams can be copied/pasted in Word or Excel. For this example: How the solids throughput (Qms) and the cake height (hc) are influenced by the belt speed (u) for two filter types: Belt filter with Reversible Trays and Continuous Belt filter. We see clearly the performance reduction for a given time for reversing the trays (Tr=3 s)
3/18
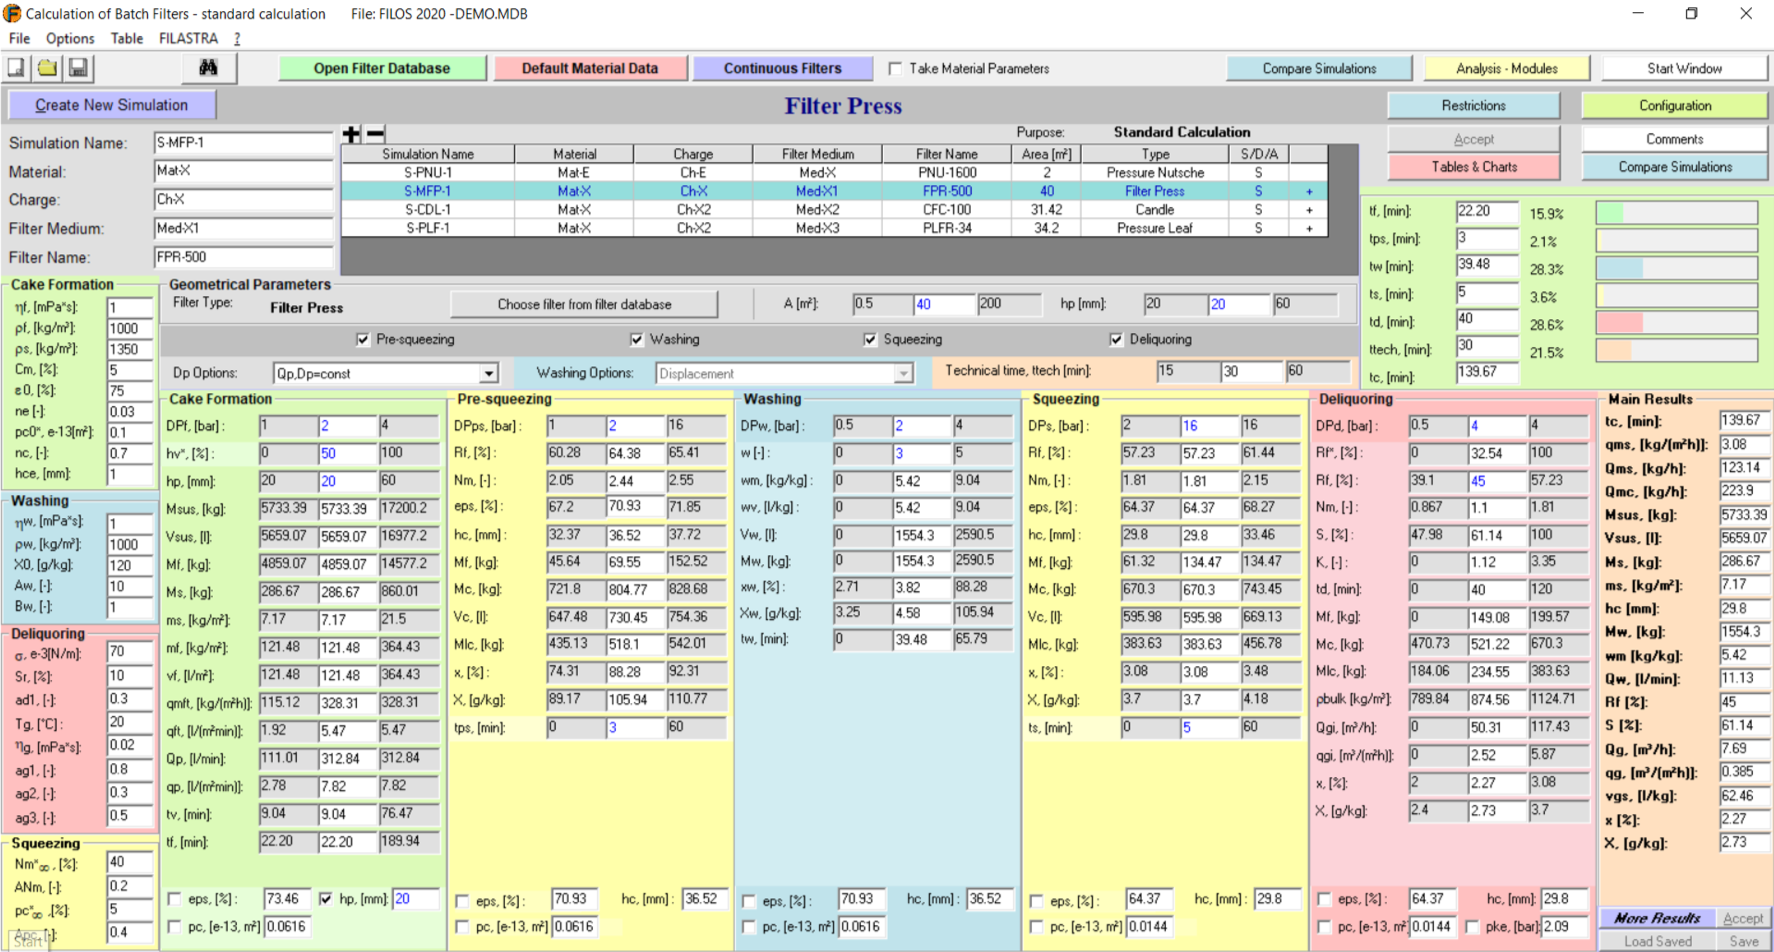
Filter Simulation window for Batch Filters – Example: Simulation of a Membrane Filter Press
Filter Simulation window for Batch Filters – Example: Simulation of a Membrane Filter Press
FILOS Simulation Window for Batch Filters: Pressure Nutsche, Candle Filters, Pressure Leaf Filters, Filter Press and Filter Press Automats. In this example we see a simulation for a Membrane Filter Press with cake squeezing before cake washing and cake deliquoring. Simulations with different filter types are listed together and can be easily compared (see Tables & Charts and Compare Simulations modules). Every Step: Cake Formation, Cake Washing, Cake Deliquoring has its own column. Highest Flexibility regarding input and calculated parameters. Material Parameters can be automatically loaded from the Data Analysis- module or Default Data can be loaded. Filter geometrical Data are saved in a Database and can be loaded to the Simulation window. Listing of the main results with graphical display of the cycle time components.
4/18
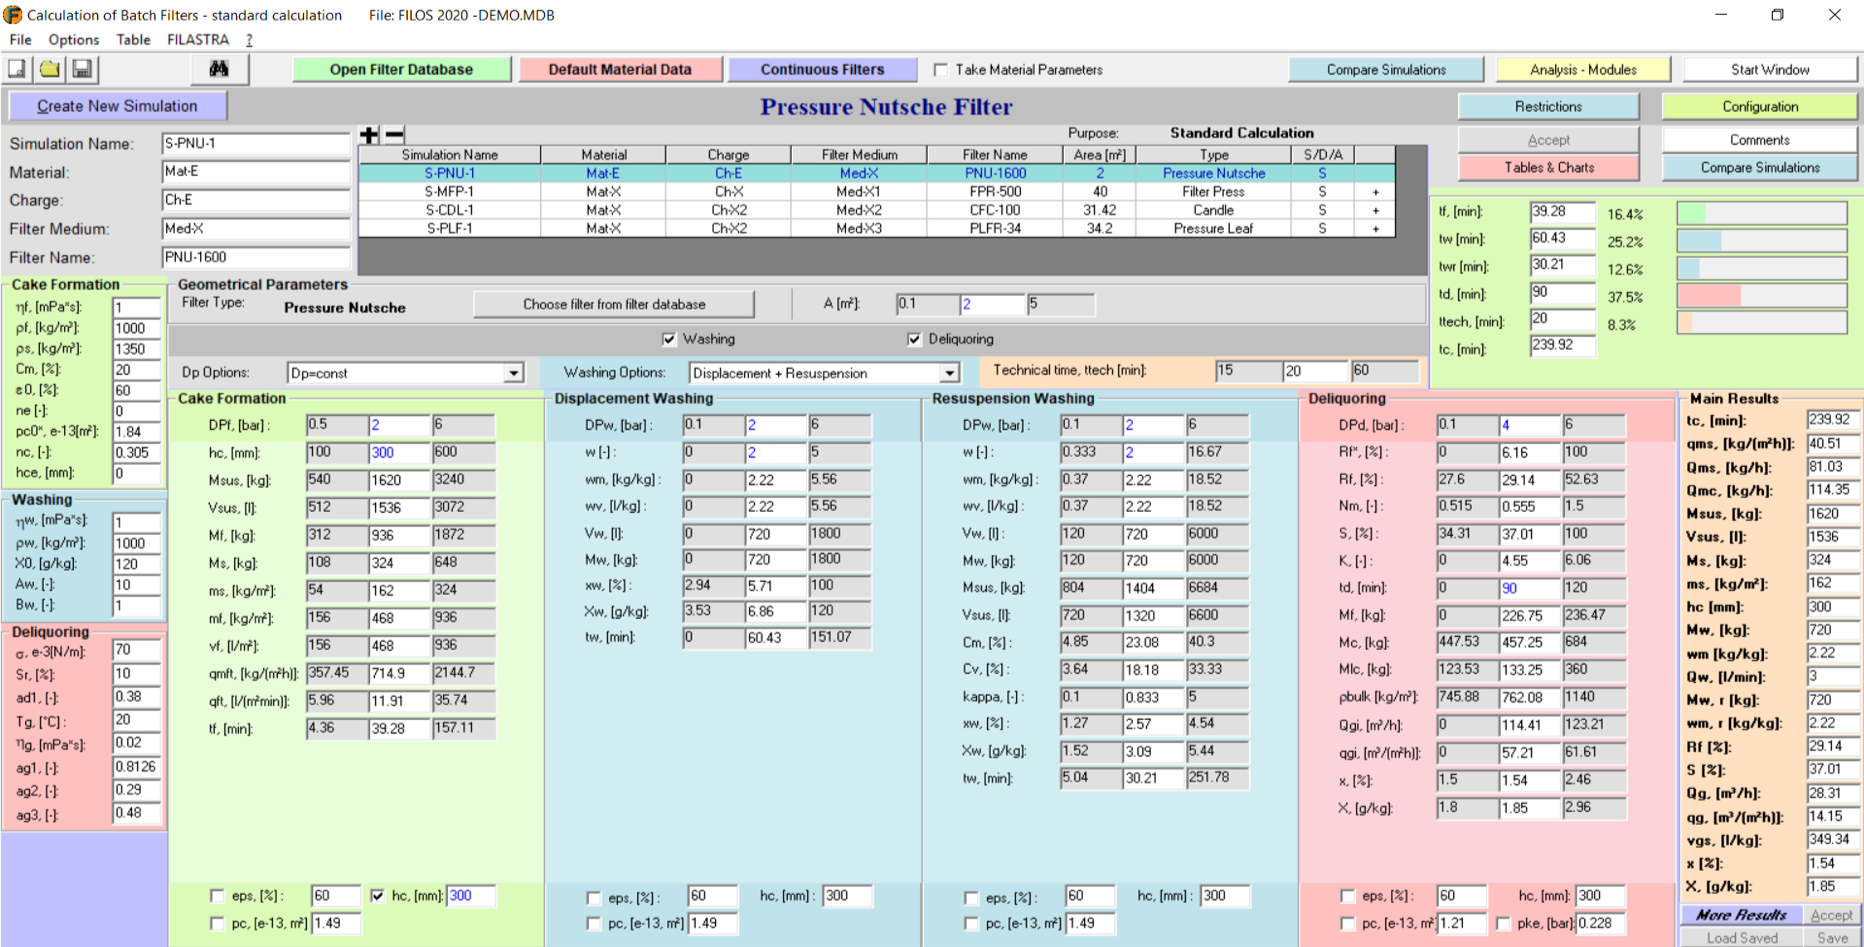
Filter Simulation window for Batch Filters – Example: Simulation of a Pressure Nutsche
Filter Simulation window for Batch Filters – Example: Simulation of a Pressure Nutsche
FILOS Simulation Window for Batch Filters: Pressure Nutsche, Candle Filters, Pressure Leaf Filters, Filter Press and Filter Press Automats. In this example we see a simulation for a Pressure Nutsche Filter with 2 washing steps: Displacement and Resuspension washing. Simulations with different filter types are listed together and can be easily compared (see Tables & Charts and Compare Simulations modules). Every Step: Cake Formation, Cake Washing, Cake Deliquoring has its own column. Highest Flexibility regarding input and calculated parameters. Material Parameters can be automatically loaded from the Data Analysis- module or Default Data can be loaded. Filter geometrical Data are saved in a Database and can be loaded to the Simulation window. Listing of the main results with graphical display of the cycle time components.
5/18
Tables & Charts window for Batch Filters
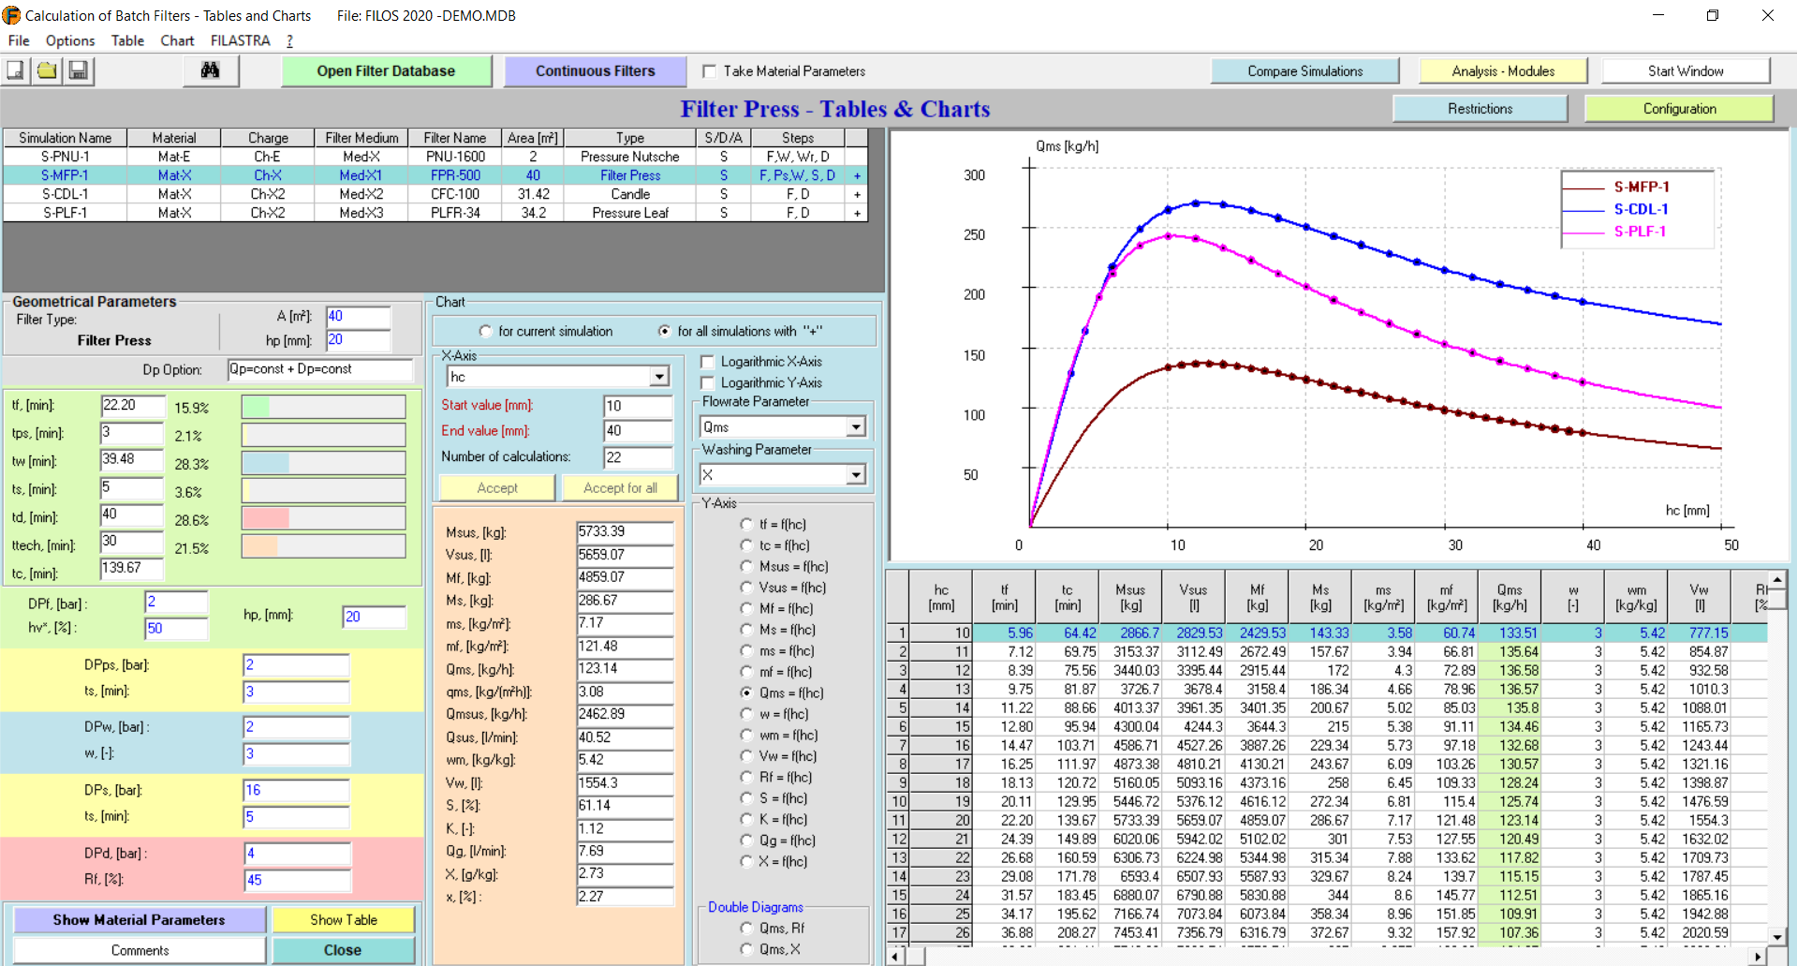
Tables & Charts window for Batch Filters
Powerful Tables & Charts window for all Batch Filters. The influence of the most important geometrical and setting parameters on the filter performance parameters can be displayed in form of tables and graphs. Performance comparisons for different filter types, different materials and different filter settings. All Tables and diagrams can be copied/pasted in Word or Excel. For this example: The Optimization diagram (Solids throughput as a function of cake height) for 3 different filter types: Candle Filter, Pressure Leaf Filter and Membrane Filter Press.
6/18
FILOS Comparison window for Filter Simulations
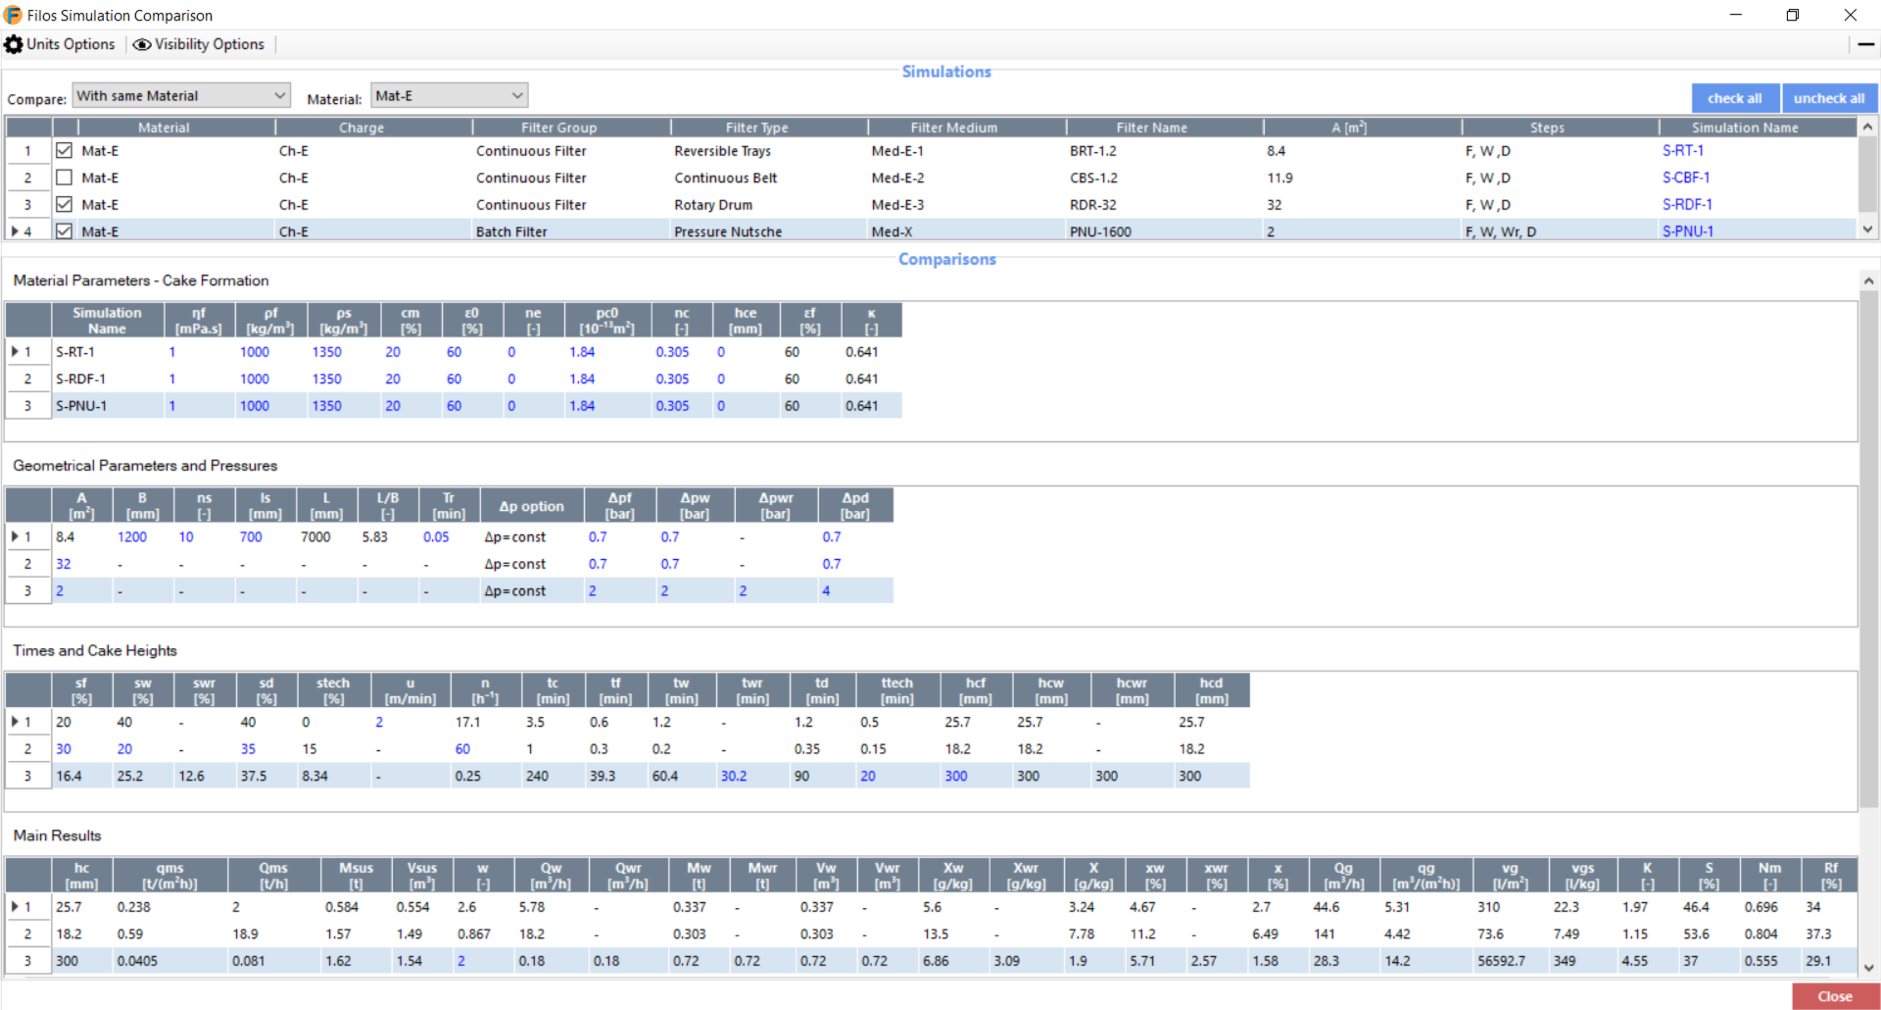
FILOS Comparison window for Filter Simulations
The powerful FILOS Comparison window. Input and Result parameters for definite selected simulations can be displayed together enabling an easy Comparison. A filter on the top of the window makes the selection of the simulations, which have to be displayed and compared very easy. Different tables For the Material parameters, the Geometrical parameters and pressures for each step, the times and cake heights. The results parameters are separated in 2 tables: Main Results and More Results. The Units Options and Visibility Options windows provides highest flexibility regarding the displayed units and the displayed parameters.
7/18
Create New Simulation Window (left) with loading of Default Material Data for the New Simulation (right)
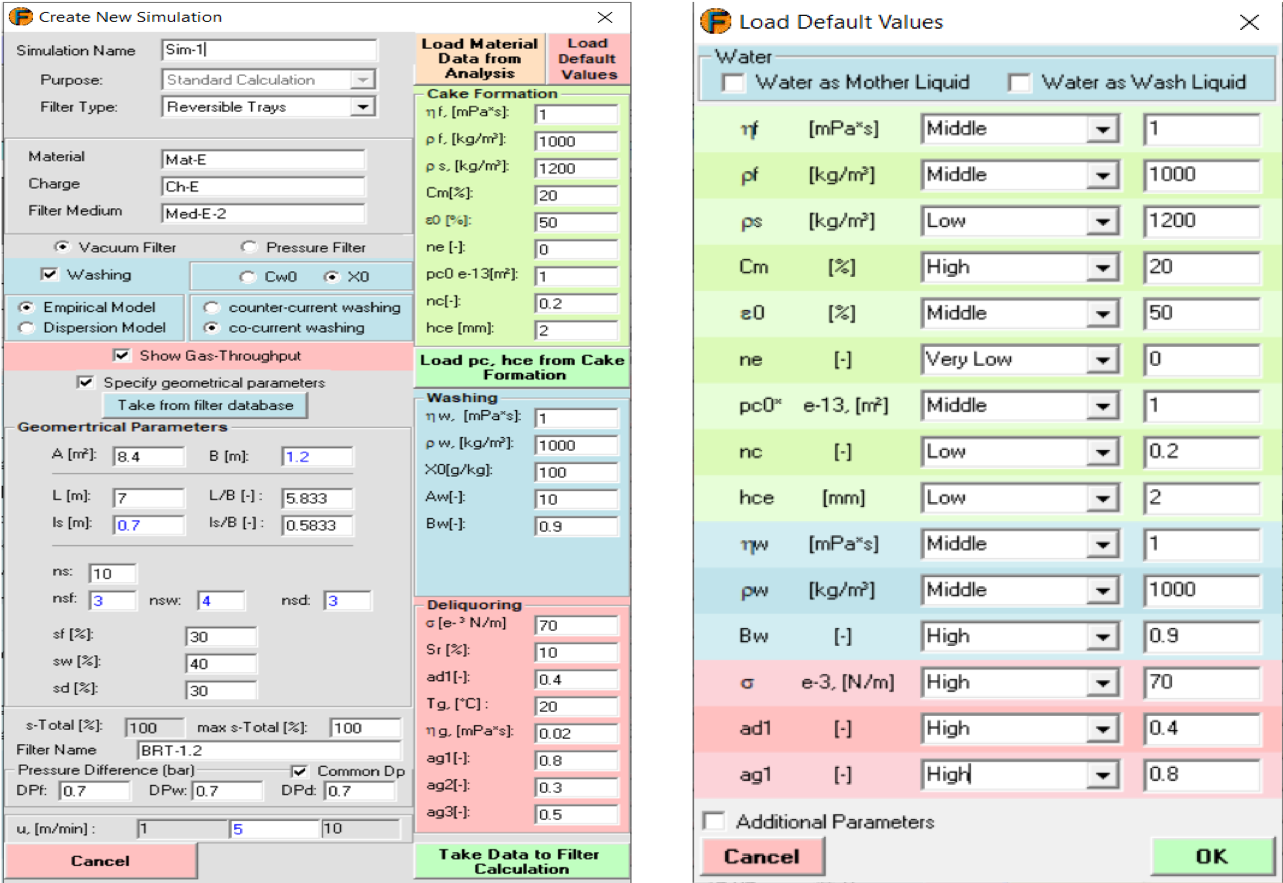
Create New Simulation Window (left) with loading of Default Material Data for the New Simulation (right)
The user-friendly window for Creating a New Simulation for the Calculation of the Filter Performance for a given Suspension, a given Filter and given filter Settings. The user is guided to enter all needed data already in this window, so that after clicking Take Data to Filter Calculation complete simulation data appear in the main simulation window (if it is needed, the user has to do in the main window only changes on the input data). The material parameters can be loaded from the FILOS-Analysis module (see button Load Material Data from Analysis). In this example we see the Create New Simulation window for a Belt Filter with Reversible Trays. On the right we see the window for Loading Default Material Data to the Create New Simulation window. These default data can be changed by the user (see Default Material Data button in the simulation main window).
8/18
FILOS- Protocol window – Example of an Experiment with Cake Formation, Washing, Squeezing and Deliquoring
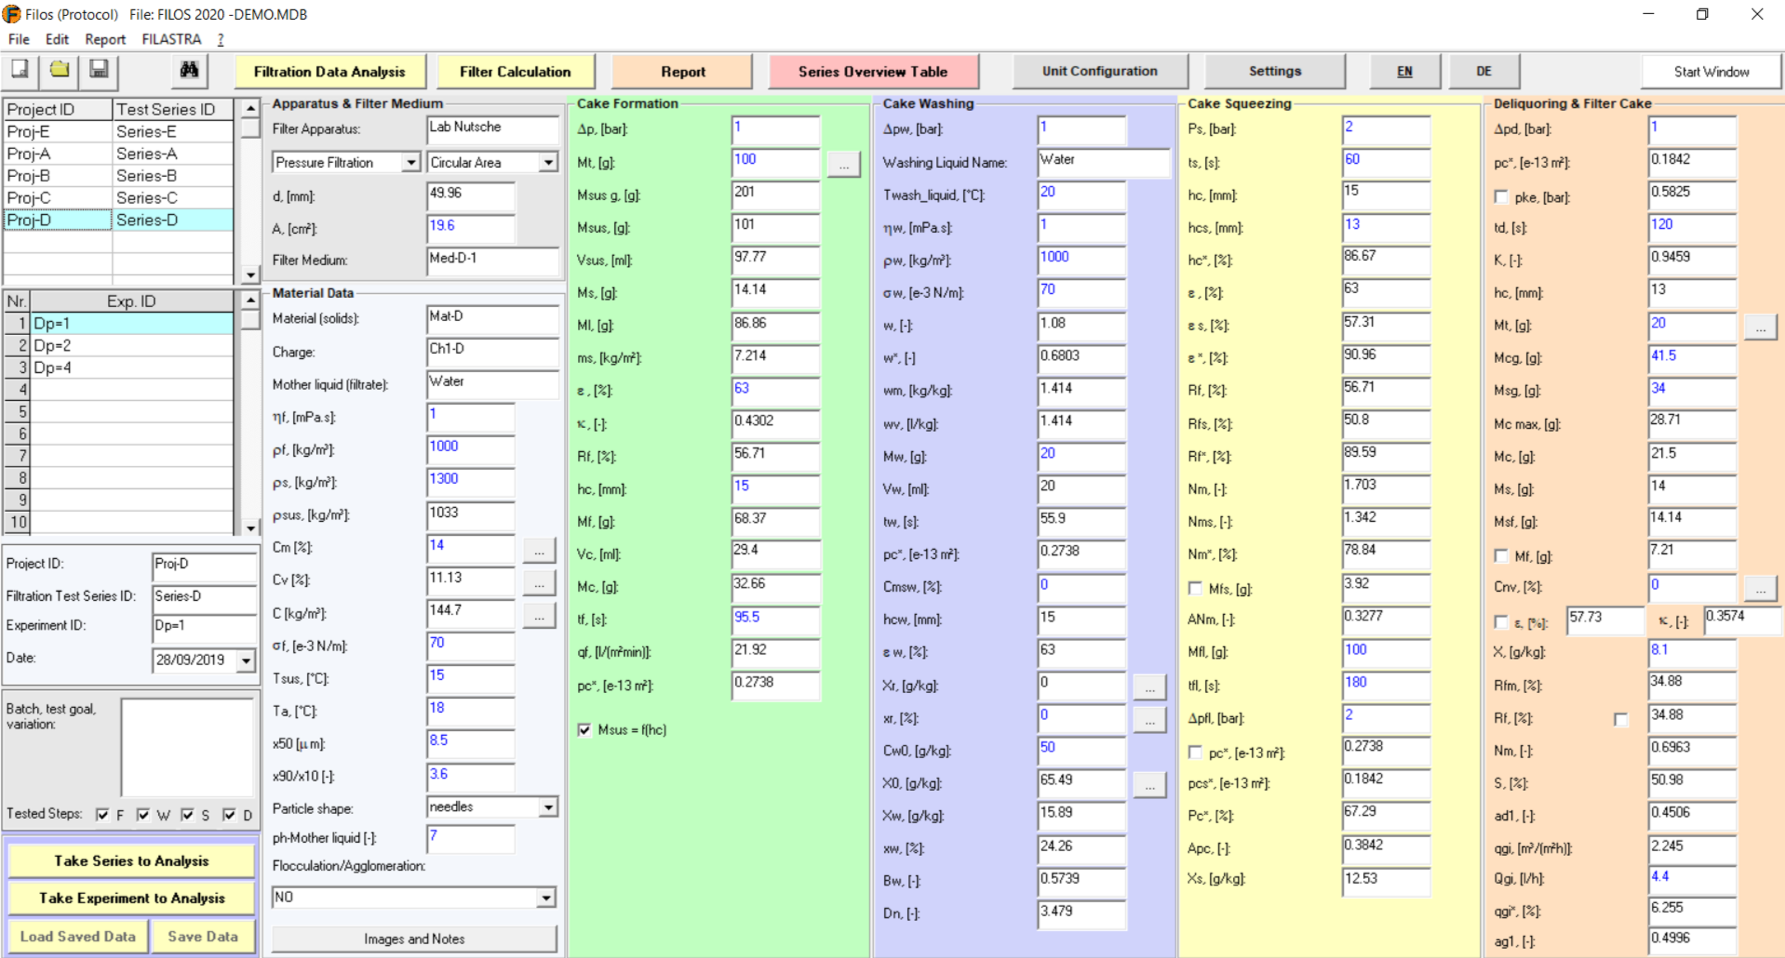
FILOS- Protocol window – Example of an Experiment with Cake Formation, Washing, Squeezing and Deliquoring
Powerful FILOS-module for entering and saving all known and measured data for every filtration experiment of a test series. Even input of data, which are not needed for the FILOS-Analysis modules but can be important for the documentation of the test series. Each experiment belongs to a definite series and every series belongs to a definite project. Projects and Series as well as experiments of each series, goal and tested steps for each experiment are listed in the first column. All data of one Series can be transferred to the FILOS-Analysis modules for Detailed judgment and determination of the necessary efficiency parameters for the filter performance simulation. The second column displays the geometrical parameters of the test apparatus and basic material data for the tested suspension. The data for each tested step are displayed in a separate column. The Protocol is also a Calculator because it calculates and displays from the entered measured data the values of many important parameters, which enable the judgment of each experiment. Highest flexibility regarding input and calculated parameters enables the use of Protocol even as a Simulator, which can be used even for the planning of the experiments. The Series Overview Table displays for comparison reasons all important input and calculated parameters for all experiments of the current test series.
9/18
FILOS- Report window
FILOS- Report window
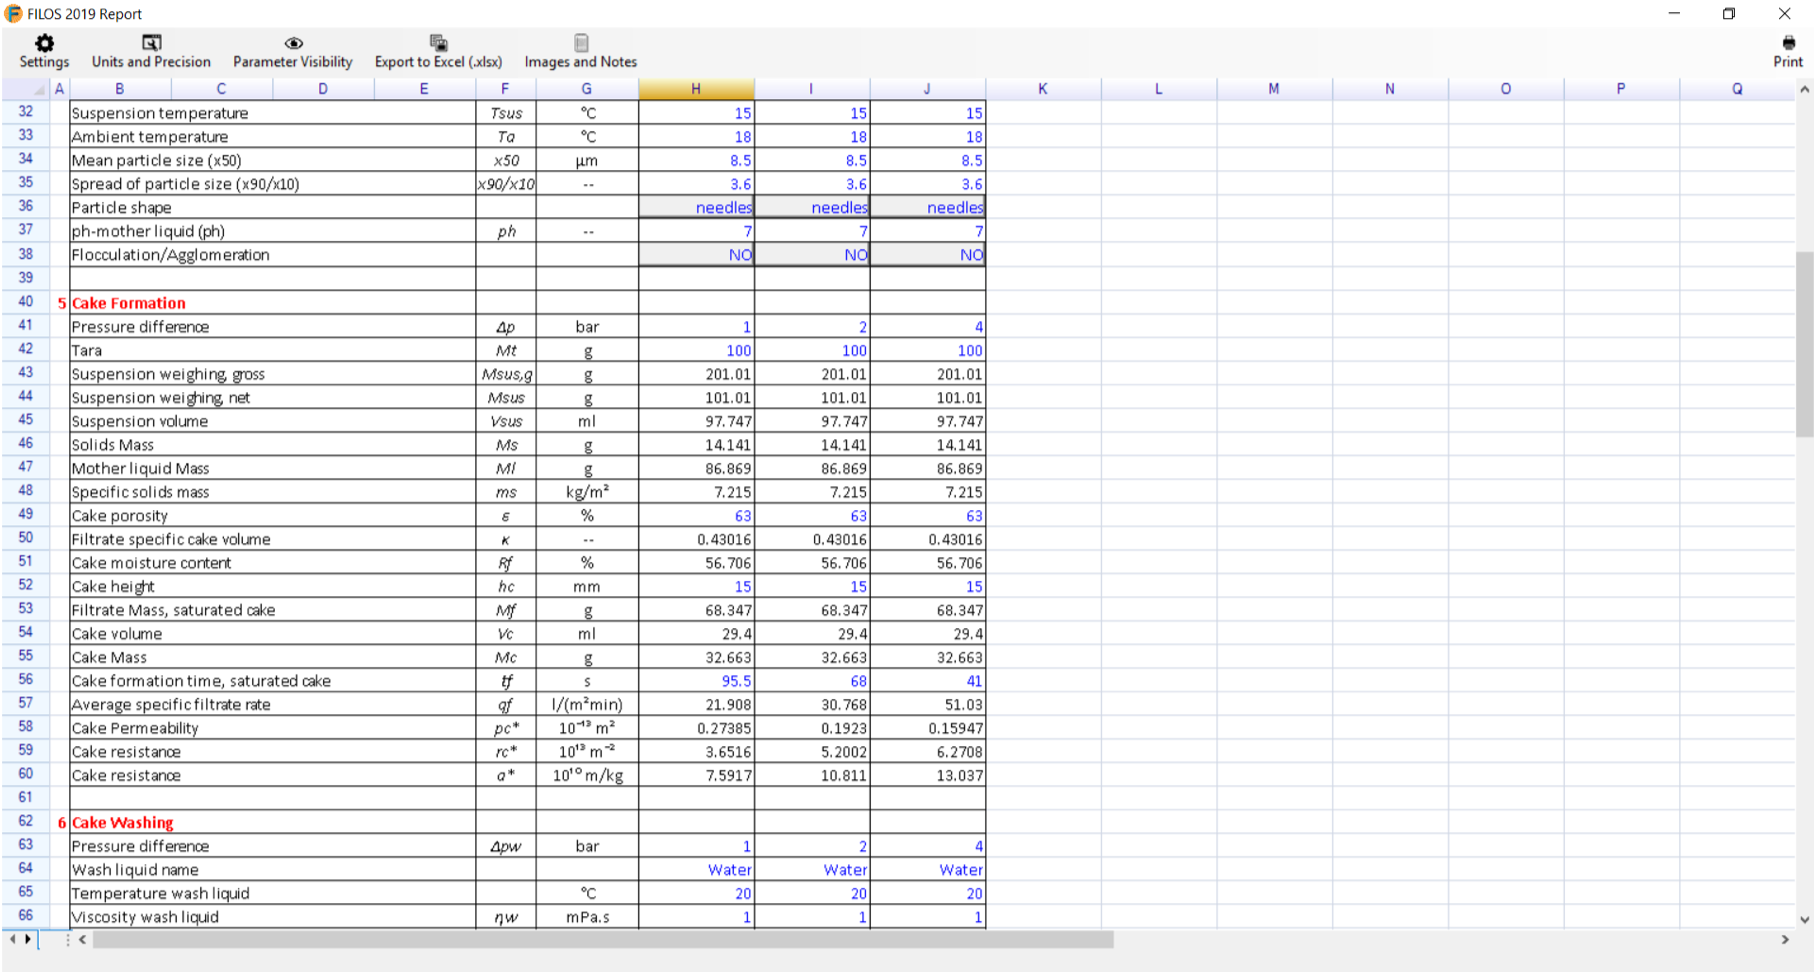
The Report is a tool of the Protocol module and enables the Excel-similar, formatted display of entered and calculated Protocol data for all experiments of one Test series. The content of the Report window can be exported to Excel. Highest flexibility regarding the displayed units and the displayed groups of parameters as well as the display of the parameters in each group. The groups in Report are the same as the groups in the Protocol window. Additionally the Report contains the results of the FILOS-Analysis modules as last group. Similar to Protocol the data can be displayed in English or in German.
10/18
Start Window of the FILOS Detailed Cake Formation Module
Start Window of the FILOS Detailed Cake Formation Module
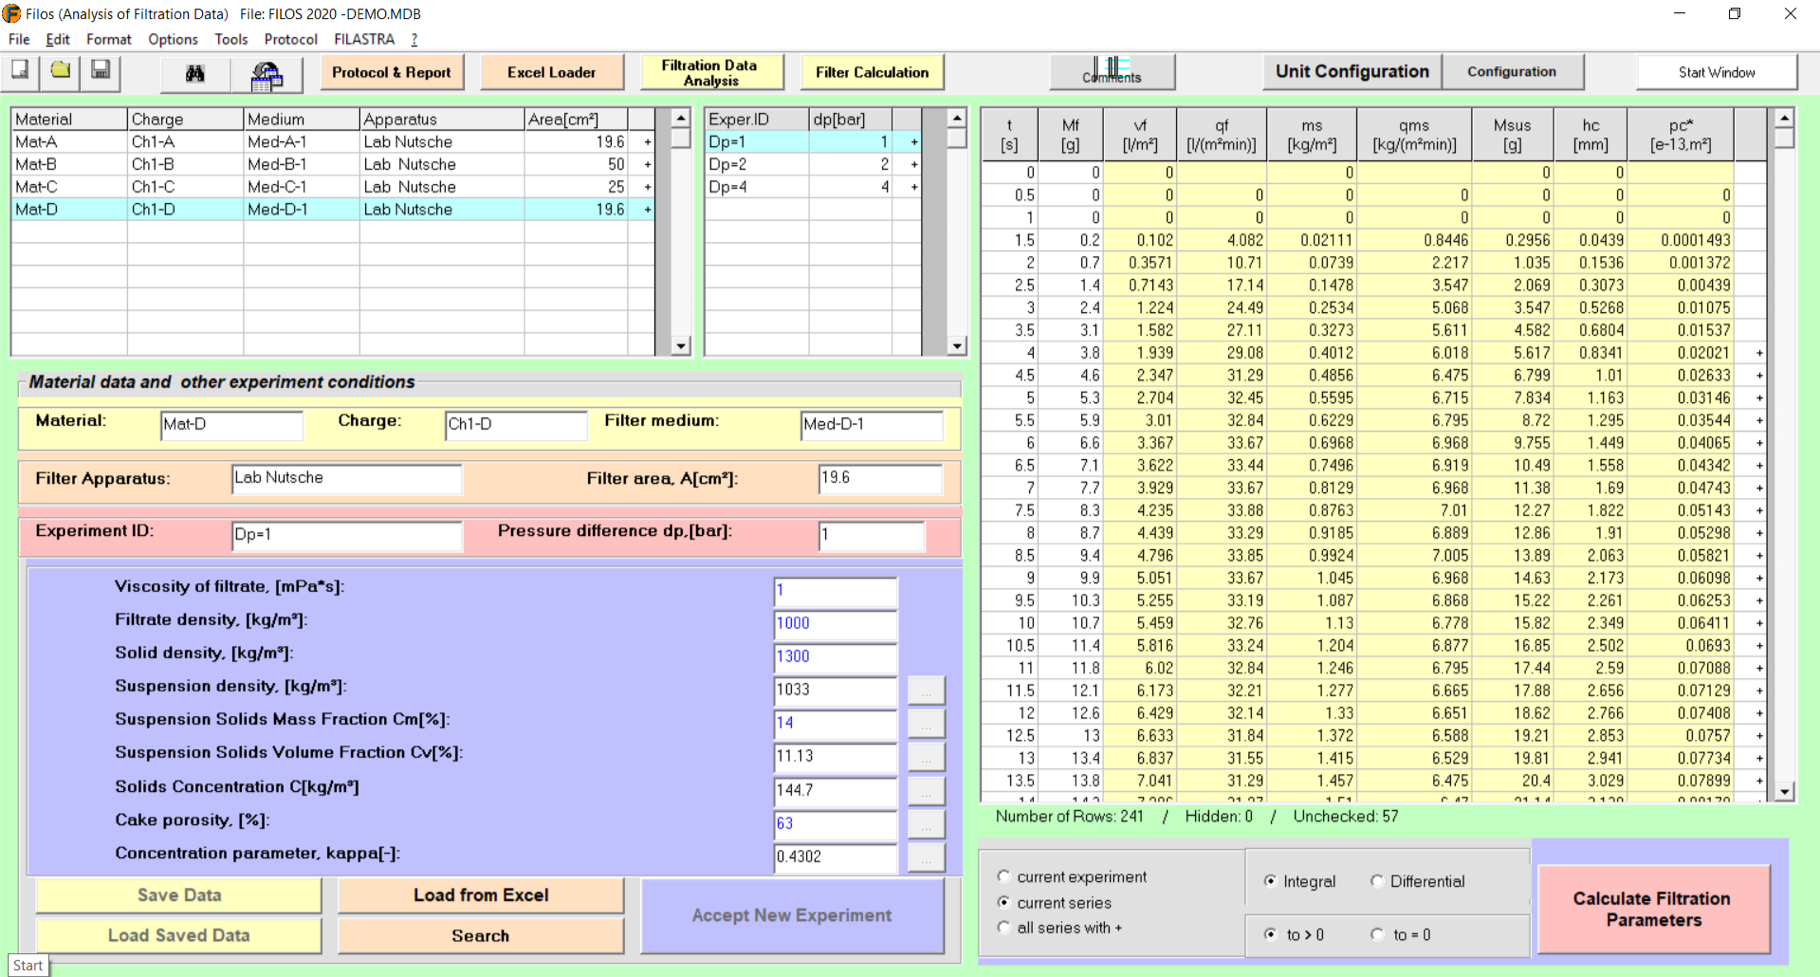
For a given test series with cake forming filtration: Enables the Input and Saving of all needed data for each cake formation experiment in order to determine the efficiency parameters for the cake formation step: Cake permeability (pc0), specific and absolute filter medium resistance (hce0, Rm0), cake compressibility (nc) and filter medium compressibility (mc). The default needed data for each experiment are: Recorded mass of filtrate with time ((t, Mf), see the first two columns of the table on the right side), viscosity and density of the mother liquid as well as solids density (all three parameters series specific). Furthermore the suspension solids content (Cm) and the cake porosity are needed. The values of these data can be loaded automatically from the Excel file by using the FILOS module Excel Loader. The first table on the left top side displays the different test series in the current program file and the second small table to its right the list of the experiments of the selected series. The yellow columns of the data input table are calculated values for each time (t) for the following parameters: Specific filtrate volume (vf), average specific filtrate rate (qf), specific solids mass and solids mass rate (ms, qms), the filtered suspension (Msus), the expected cake height (hc) and the cake permeability pc* (the description pc* instead of pc indicates that in the pc* - parameter the filter medium resistance is included (pc*: permeability of the system filter cake-filter medium).
11/18
Analysis Window of the FILOS Detailed Cake Formation Module
Analysis Window of the FILOS Detailed Cake Formation Module
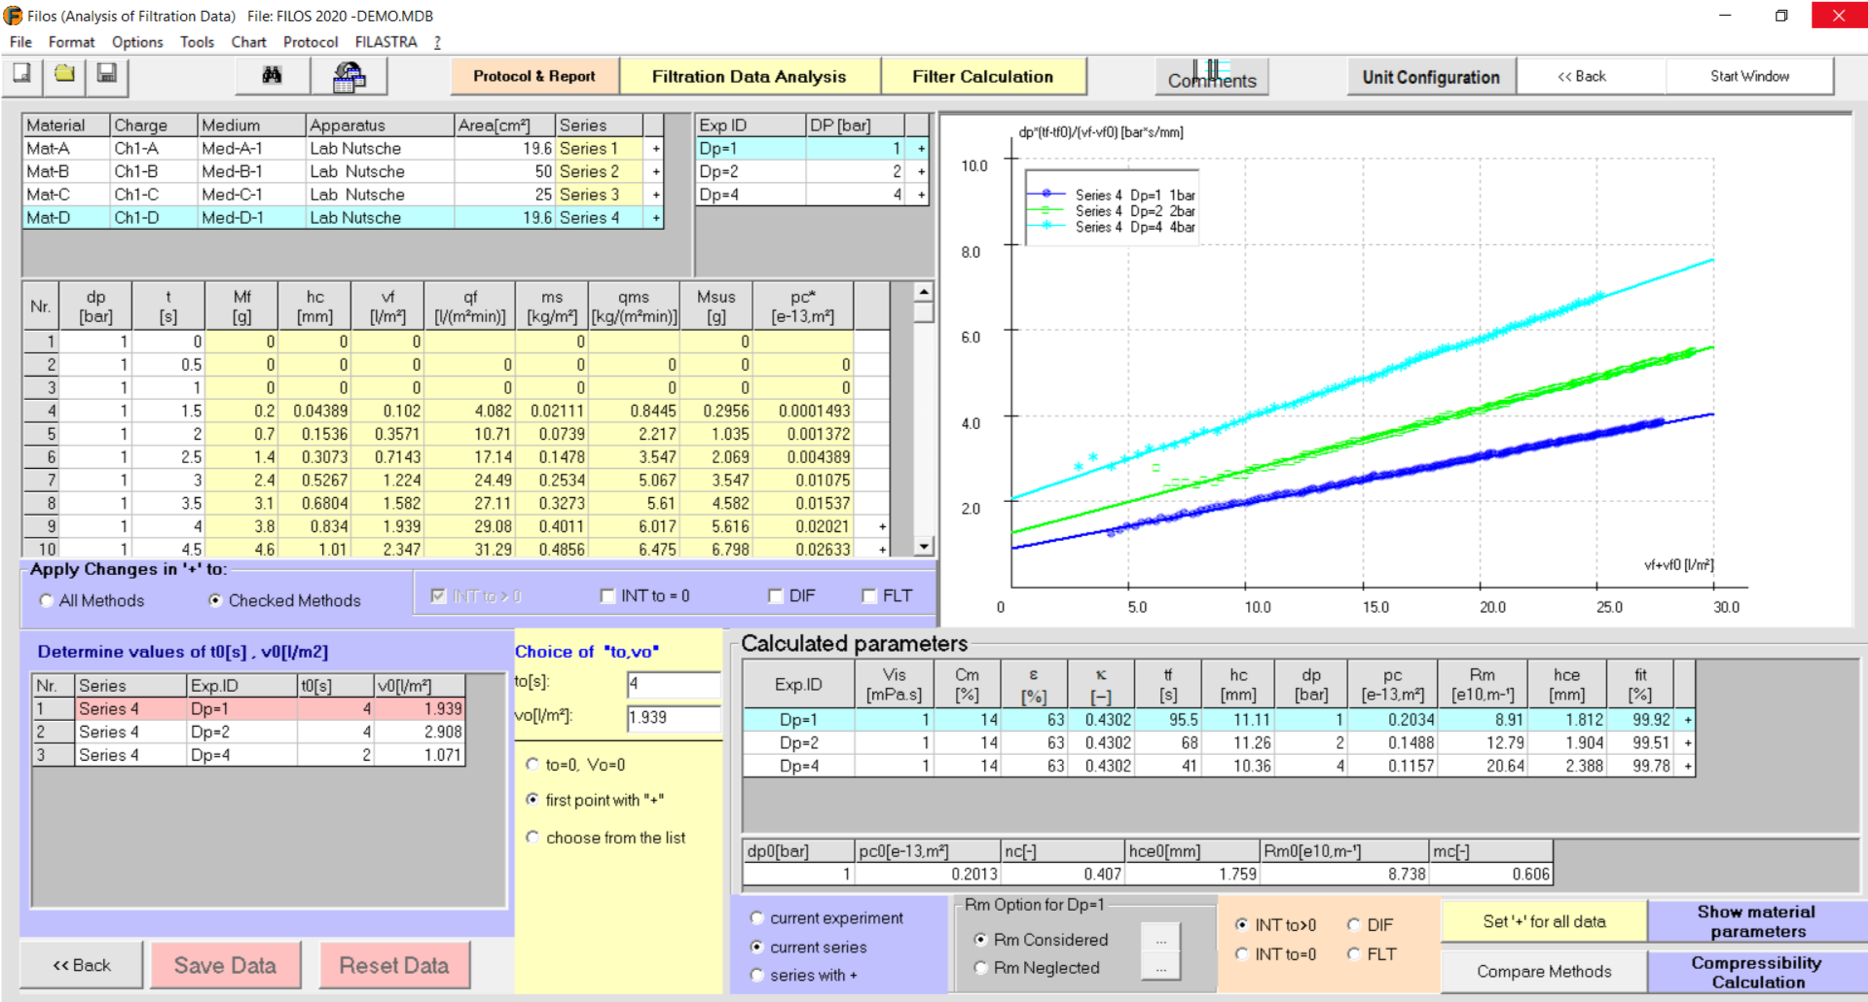
Example of the FILOS-Analysis window with the theory-based plot of three experiments at three different pressures (Analysis method: General Integral). The different slopes of the regression lines is an evidence of a compressible cake (nc>0). The higher the pressure difference, the bigger the slope of the straight line that means the lower the cake permeability (pc). In case of an incompressible cake all lines are parallel. For each experiment the determined pc-, Rm- and hce-values are displayed in the table below the diagram. Below this table, we have the “final” results: (pc0, nc) and (Rm0, hce0, mc) values. In the analysis window, the user can choose and see the analysis results of any test series that means in the same file the data of many test series can be saved and compared to each other. The number of the measurements can be reduced. Very important is that the user can choose one of four options for the analysis of the test data.
12/18
Data Input Window of the FILOS - Cake Deliquoring module
Data Input Window of the FILOS - Cake Deliquoring module
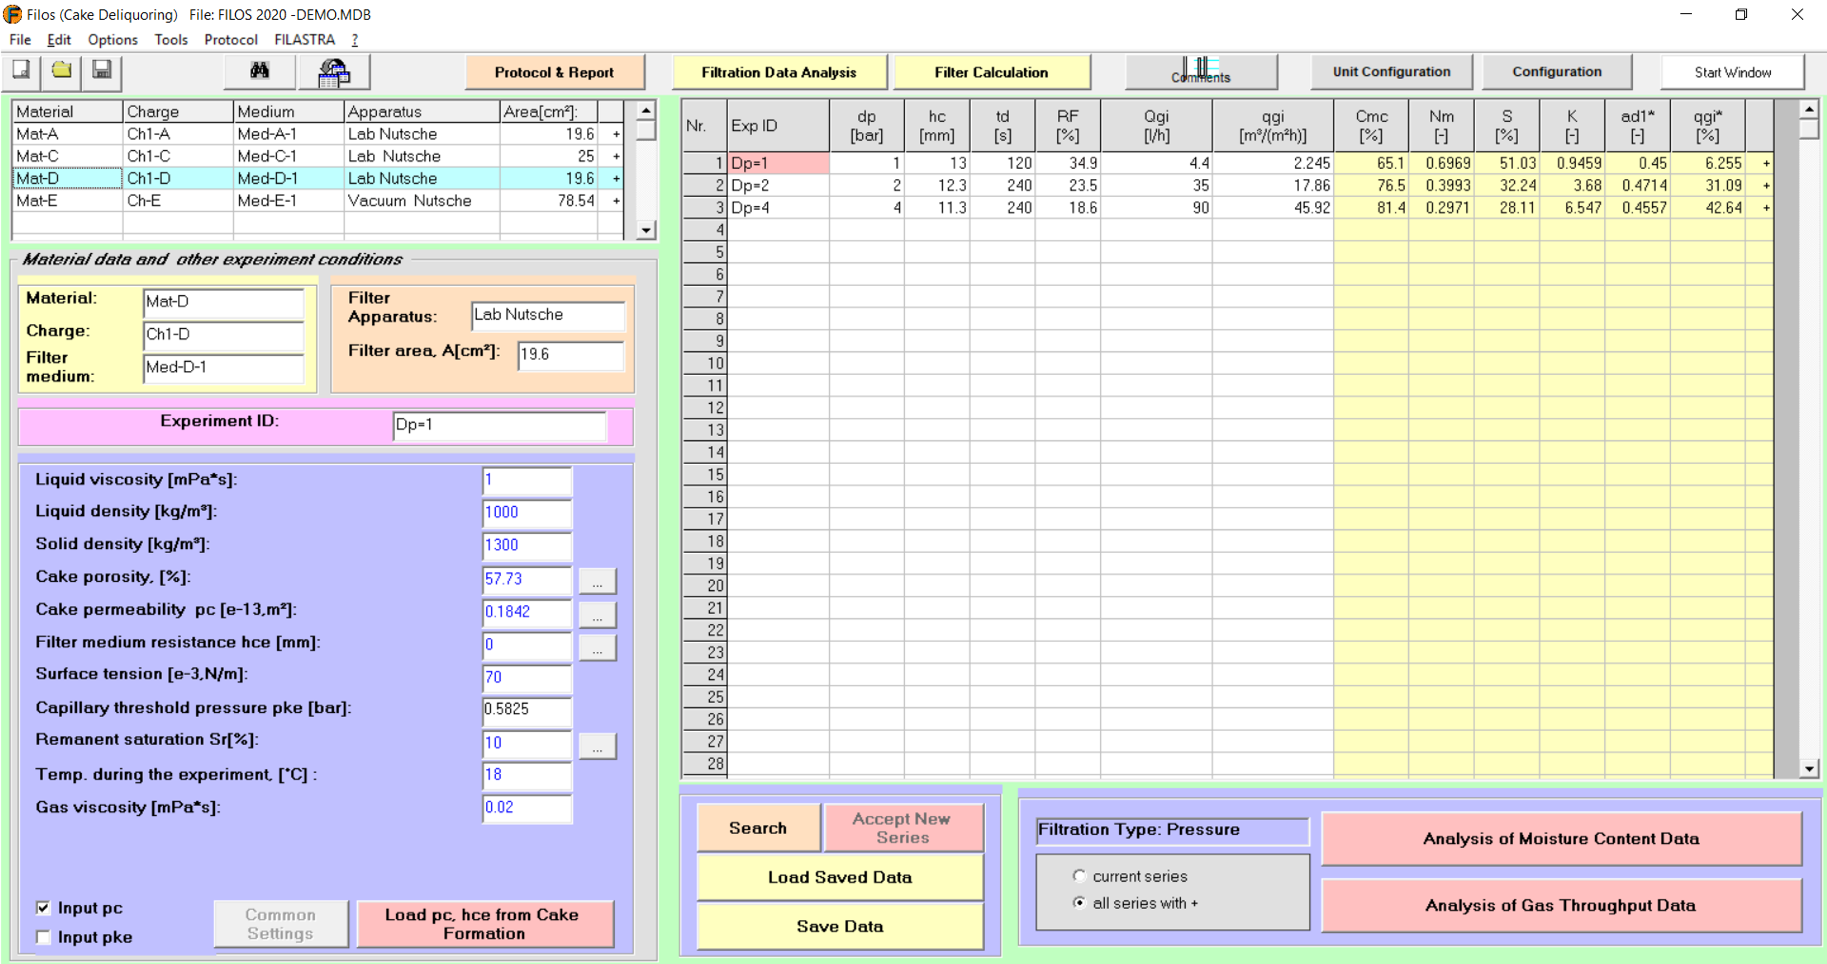
Main input parameters for each experiment are the measured cake moisture content Rf at the end of the test and the experimental settings: Pressure difference (dp), cake height (hc) and deliquoring time (td). Optional (see Configuration window) is the input of the gas volume flow rate at the end of the deliquoring experiment (Qgi: absolute instantaneous or qgi: area specific instantaneous gas volume rate). The parameters with the yellow background colour in the data input table are all calculated. Their values enable the judgment of each experiment before going to the Analysis windows. The parameters in the blue field in the bottom left side of the window are necessary inputs for the analysis of the test data.
13/18
Analysis window of the FILOS -Cake Deliquoring module (Analysis of cake Moisture content)
Analysis window of the FILOS -Cake Deliquoring module (Analysis of cake Moisture content)
FILOS window for the analysis of cake moisture content (Rf) measurements. As main results are the values of the adaptation parameters, ad2 and ad1 (see table below the diagram). By default the program sets ad2=5 and the determined ad1-value is then defined as the deliquoring efficiency. The theory-based plot enables the judgment of the quality of the measured data. The analysis results of more than one test series can be displayed together enabling a comparison of the deliquoring efficiency of different suspensions.
14/18
Analysis window of the FILOS -Cake Deliquoring module (Analysis of Gas Flow Rate)
Analysis window of the FILOS -Cake Deliquoring module (Analysis of Gas Flow Rate)
Analysis window of the FILOS module Cake Deliquoring for the gas flow rate through the cake during the cake deliquoring step. Main goal of the analysis of gas flow rate measurements is the determination through regression analysis of the adaptation parameters ag1, ag2, ag3. By having these series specific parameters, the gas flow rate for industrial filters can be calculated enabling the design of the compressor.
15/18
Data Input window of the FILOS module Cake Washing
Data Input window of the FILOS module Cake Washing
The data input window of the FILOS Cake Washing Analysis module. On the top left side, we have the listing of all test series in the current program file for which we have washing test data. In the blue field on the left bottom side, we have experiment und series specific material parameters, which are used for the analysis of the entered measured data. The measured data are entered in the data input table. The columns with the yellow background color, display calculated values of important parameters: expected washing time (tw), washing ratio related to the cake volume (w*), cake saturation of the discharged cake (S), specific wash out content of the discharged cake (x*), specific wash out content directly after the washing step (xw*), washing kinetic parameter (w) and the washing efficiency parameters for each experiment (Bw and Dn for the empirical and dispersion model respectively). For one cake washing experiment we need to know the cake height (hc), the pressure difference (Dpw), the wash liquid mass or volume (Mw/Vw), the wash out content of the discharged cake (X) and the cake moisture content (Rf). Since the measured parameter is the wash out content of the discharged cake (X) and for the analysis of the washing data we need the specific wash out content directly after the washing step (xw*) the program calculates xw* from the wash out content of the discharged cake (X) and from the cake moisture content (Rf).
16/18
Analysis window of the FILOS module Cake Washing
Analysis window of the FILOS module Cake Washing
Analysis results window of the FILOS- Cake Washing module. On the top left side, we see the list of all test series, which have washing data. Below the test series table we see the measured washing data for each experiment (white background color), which are necessary for the determination of the washing efficiency parameters. With a yellow background color, we see the calculated values of other important parameters, which allow us to judge the quality of the experiment. The judgment of the quality of the experiment is also possible in the theory-based diagram. The two tables below the diagram display the efficiency parameters for the empirical (Aw, Bw) and the dispersion model (Dn0, aw) for the selected series or for all series with “+” in the series list on the top left side. The display of the results in form of diagrams and tables for more series (see option: all series with +) allows among others the comparison of different suspensions regarding the washing efficiency.
17/18
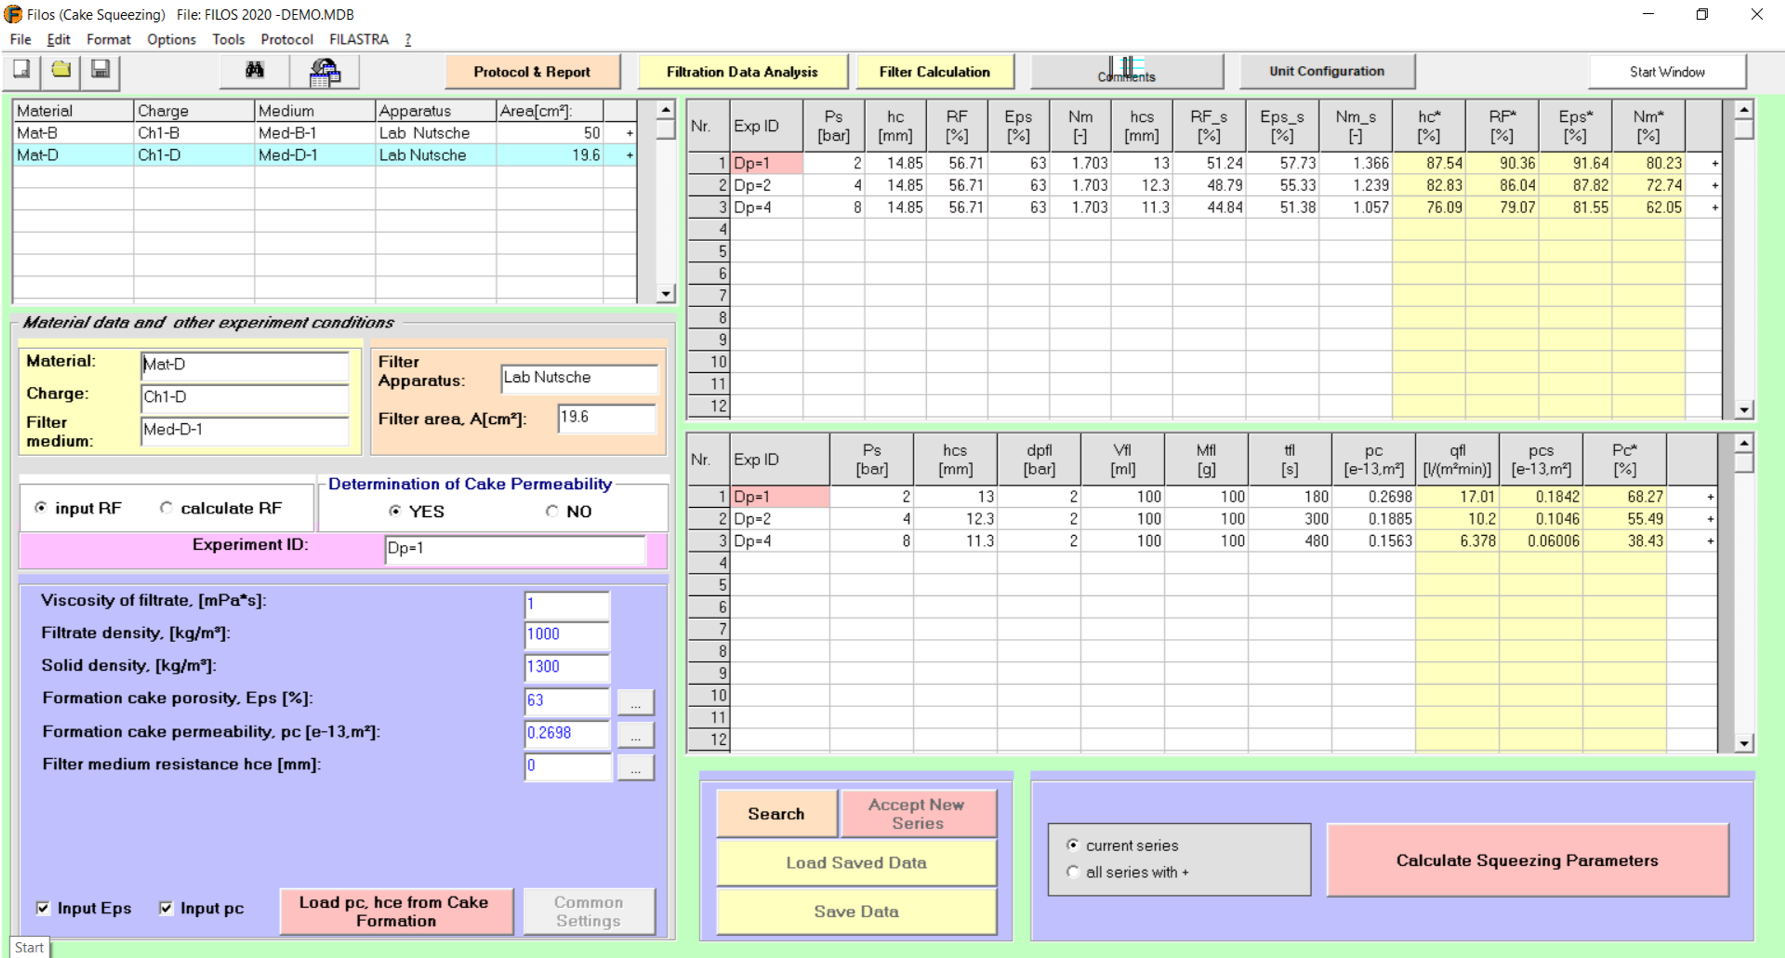
Data Input window of the FILOS module Cake Squeezing
Data Input window of the FILOS module Cake Squeezing
Data Input window of the FILOS module Cake Squeezing. The second data input table on the right bottom side is optional. It appears only if we select the option “Determination of Cake Permeability”. That means if we want to know the dependency of the cake permeability with variation of the squeezing pressure Ps. Such a dependency is needed if in industrial applications the cake has to be squeezed before washing (so called Presqueezing) or, if after squeezing the cake has to be deliquored. The table on the top left side is listing all series with squeezing data. The blue field at the left bottom side includes all material parameters of the unsqueezed cake, which are necessary for the analysis. Default inputs in the data input table are the Exp. Id, the squeezing pressure (Ps) and the cake heights before and after the squeezing step (hc, hcs). All other parameters are then calculated.
18/18
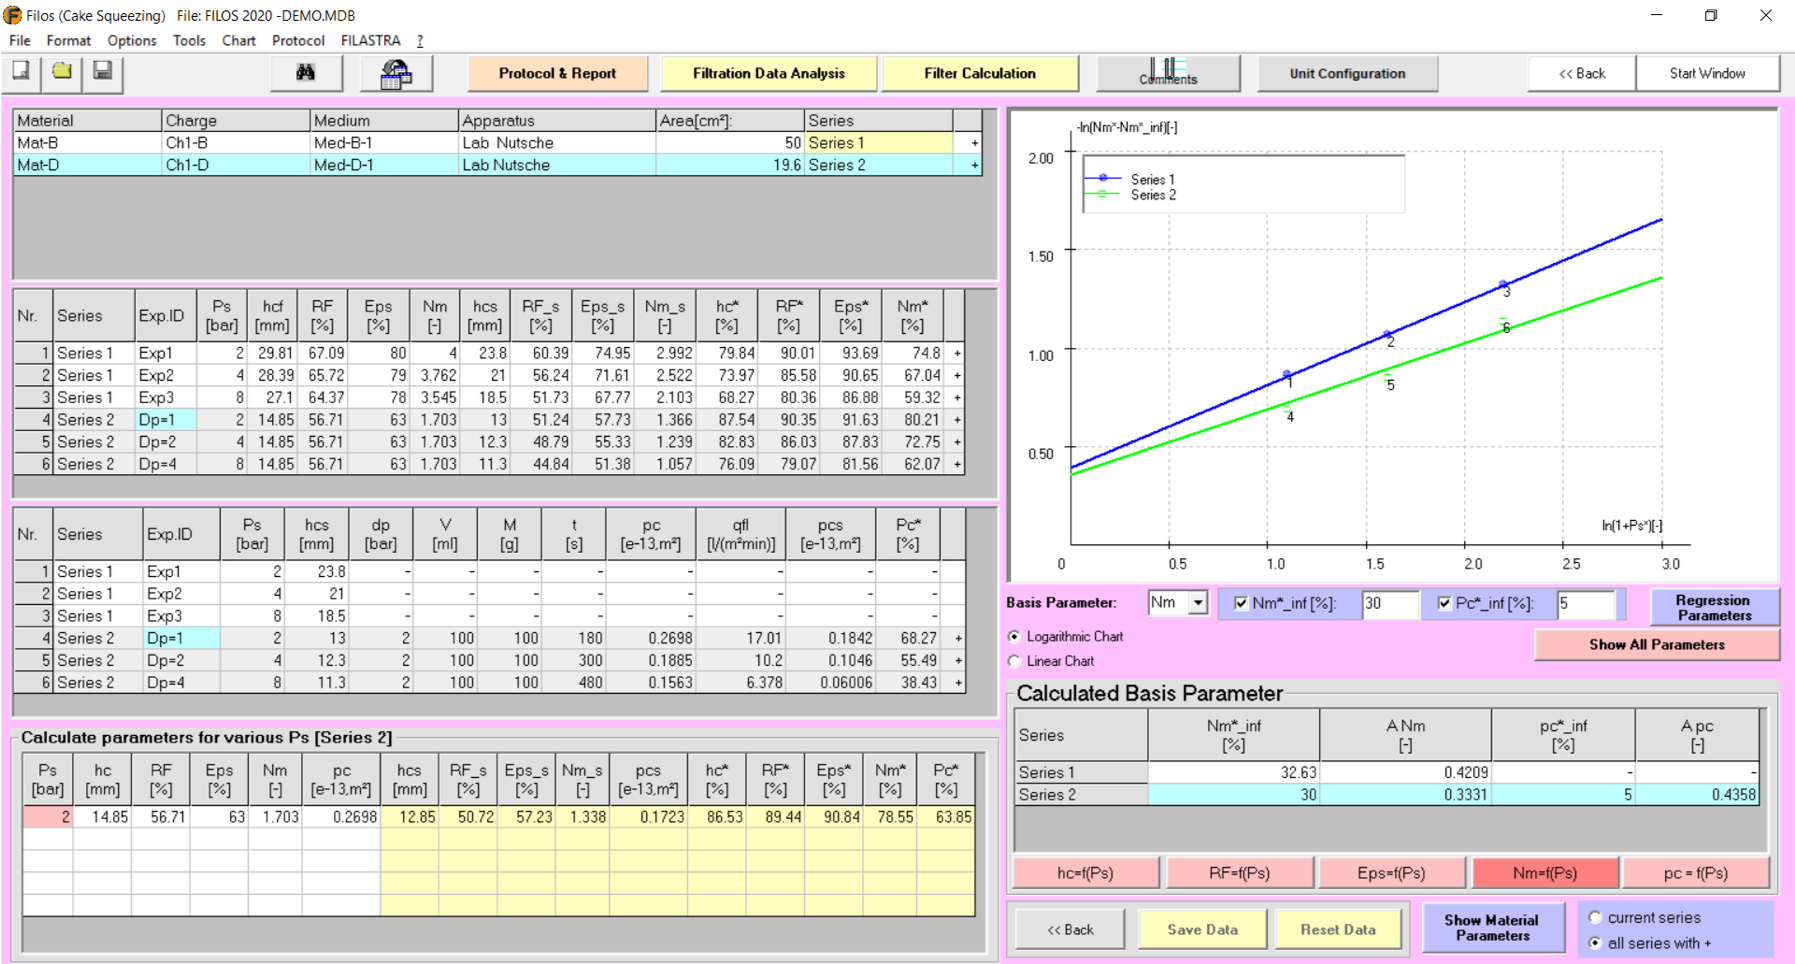
Analysis window of the FILOS module Cake Squeezing
Analysis window of the FILOS module Cake Squeezing
Results window of the FILOS module Cake Squeezing. The main goal of this window is the determination and display of the squeezing efficiency parameters ANm and Apc (see one-row table below the diagram). The latter parameter is optional and is only needed if the permeability of the squeezed cake has to be known for the Filter Calculation modules. The theory based plotting of the measured data enables the judgment of each measurement and the data correction. Since all series with squeezing data are displayed also in the analysis results window, by choosing the option “all series with +” a comparison of the squeezing efficiencies for different suspensions can be done. The tables with the measured data below the series table can be corrected. This is very useful for the case that some values are not entered correctly in the Data Input window (first module window) and have to be corrected, or if we want to study the influence on the squeezing efficiency when some values are changed. With “Reset Data” any changes we do in this window are not valid anymore and the window returns back to its original data. The table on the left bottom side is a Calculator for the Squeezing step. Only the squeezing pressure Ps has to be entered and all other parameters are calculated.
CENTRISTAR
-
Batch Filtering Centrifuges – Scale-Up, Performance Calculation, Optimization
for any given suspension and any given machine constructive and setting parameters. Consideration of all steps: Cake formation with intermittent feeding and the optional steps: Predeliquoring, Washing and Deliquoring
-
Analysis of Experimental Data
from industrial or pilot centrifuges, from laboratory Bucket Centrifuges or from Nutsche Filters. Test results from different apparatuses can be analyzed and plotted together enabling among others a direct comparison of their results
-
Database
including all machines, all suspensions and all analysis and centrifuge simulation data
Start window of CENTRISTAR
The main window for the Simulation of the performance of Batch Filter Centrifuges
Detailed Simulations window of CENTRISTAR for the cake formation step
Tables & Charts window of CENTRISTAR
The simulations - comparison window
The Machine Database window
Suspensions database window
CENTRISTAR window for the analysis of so-called Flow-Through experiments
CENTRISTAR window for the analysis of cake washing experiments
CENTRISTAR window for the analysis of cake deliquoring experiments
Import Machines-Suspensions-Test Series- Simulation Series from other files to the Current file
1/11
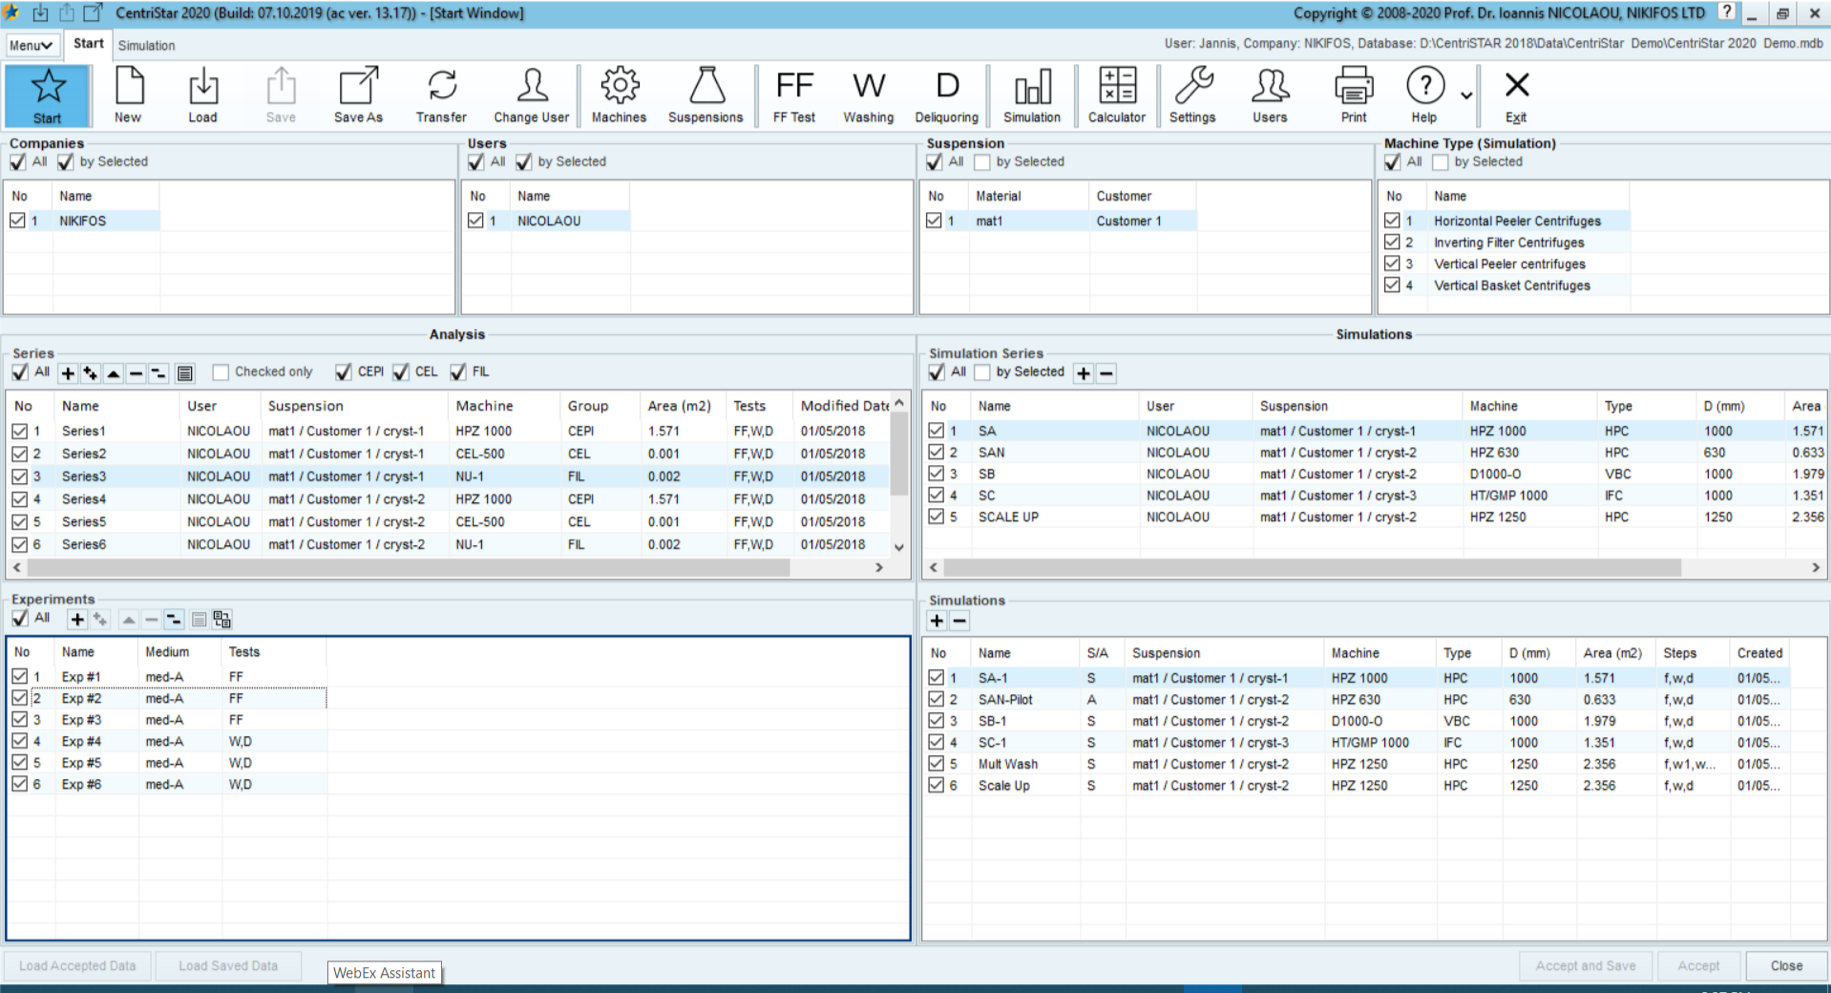
Start window of CENTRISTAR
Start window of CENTRISTAR
The Start window of CENTRISTAR displays all Analysis Test Series (left side) and Simulation Series (right side) and enable us an overview of the contents of the file regarding test and simulation series. On the left bottom side, we have the display of the experiments of the selected test series and on the right bottom side, we see the simulations, which are displayed in the Simulation window. The taskbar on the top of the Start window with its 19 commands enables the user- friendly access of any program tool and any function. Most important is the Simulation button for starting the simulation module.
2/11
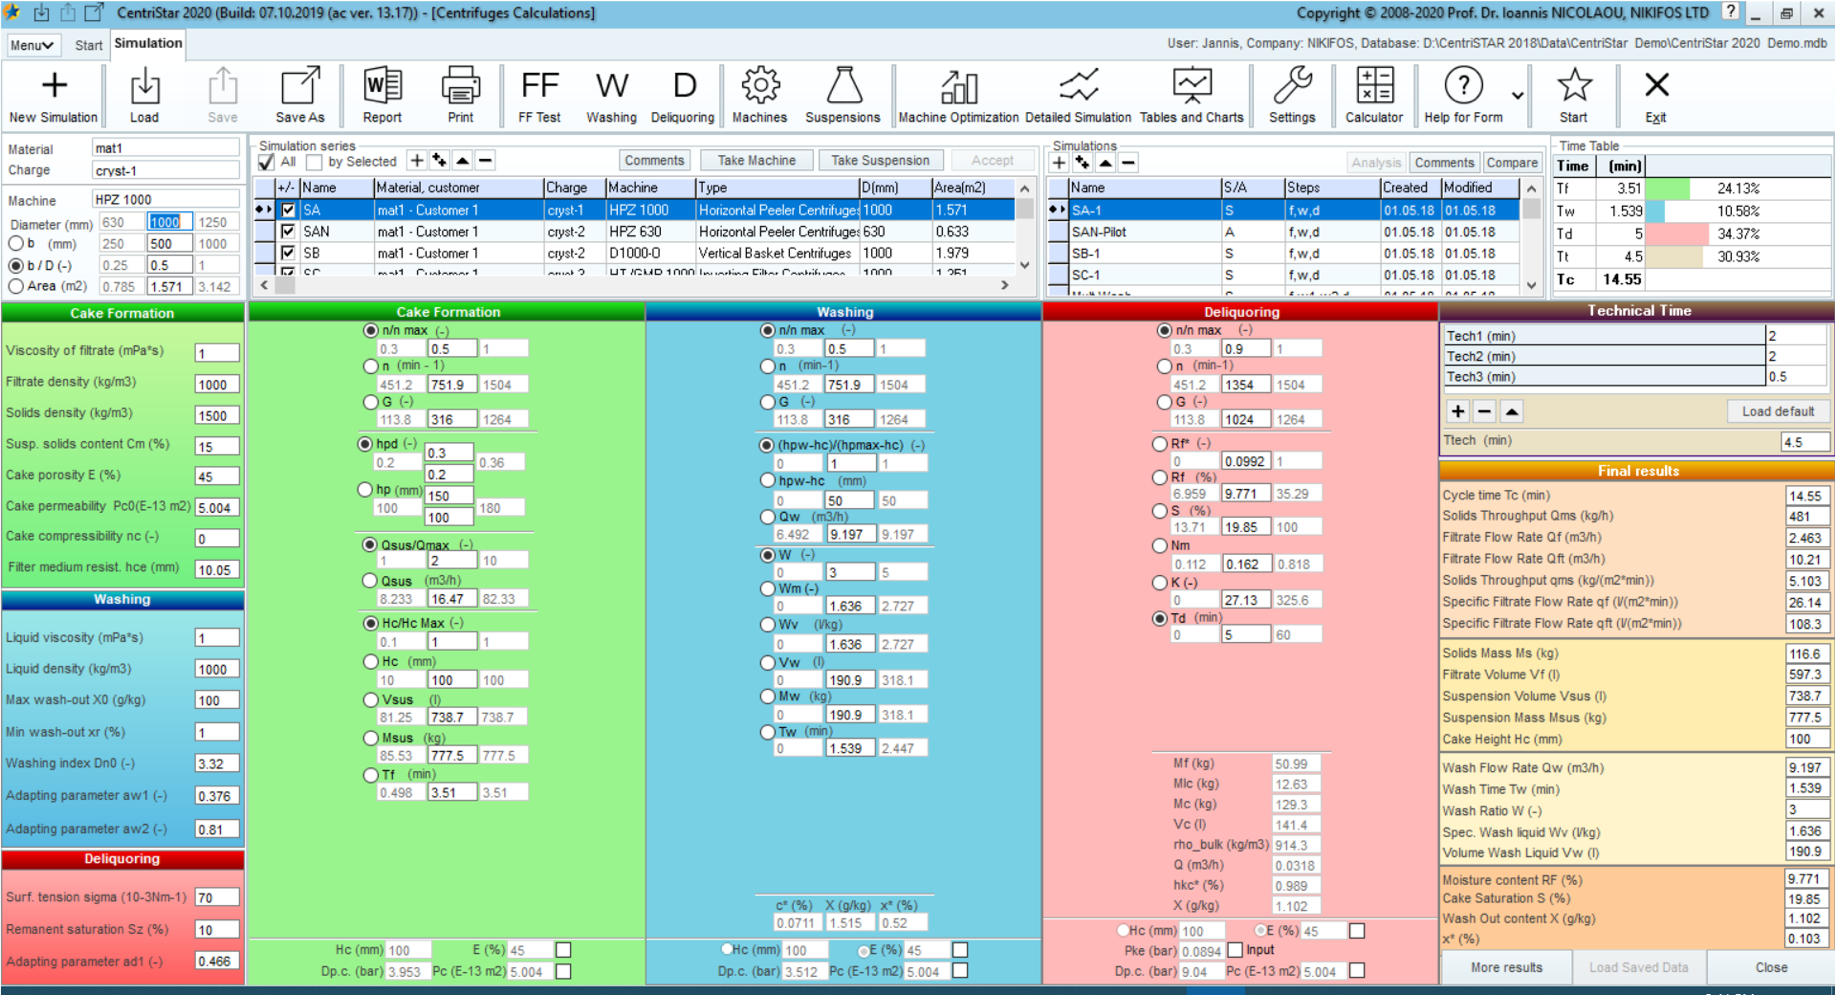
The main window for the Simulation of the performance of Batch Filter Centrifuges
The main window for the Simulation of the performance of Batch Filter Centrifuges
The Simulation module considers not only the cake formation step but also the cake washing (with or without predeliquoring) and cake deliquoring. In the Simulation settings window, the user can choose the steps, which have to be considered for the current simulation. Regarding the cake formation step the intermittent feeding is considered (feeding of the machine with constant suspension flow rate followed by drainage of the accumulated liquid over the cake). The calculation of cake formation, cake washing and cake deliquoring takes into consideration the cake compressibility and also includes the possibility of combining a gas overpressure with the always-existing centrifugal pressure. The consideration of the cake deliquoring prior to cake washing (so-called predeliquoring) is also possible as well as Multiple –Washing.
3/11
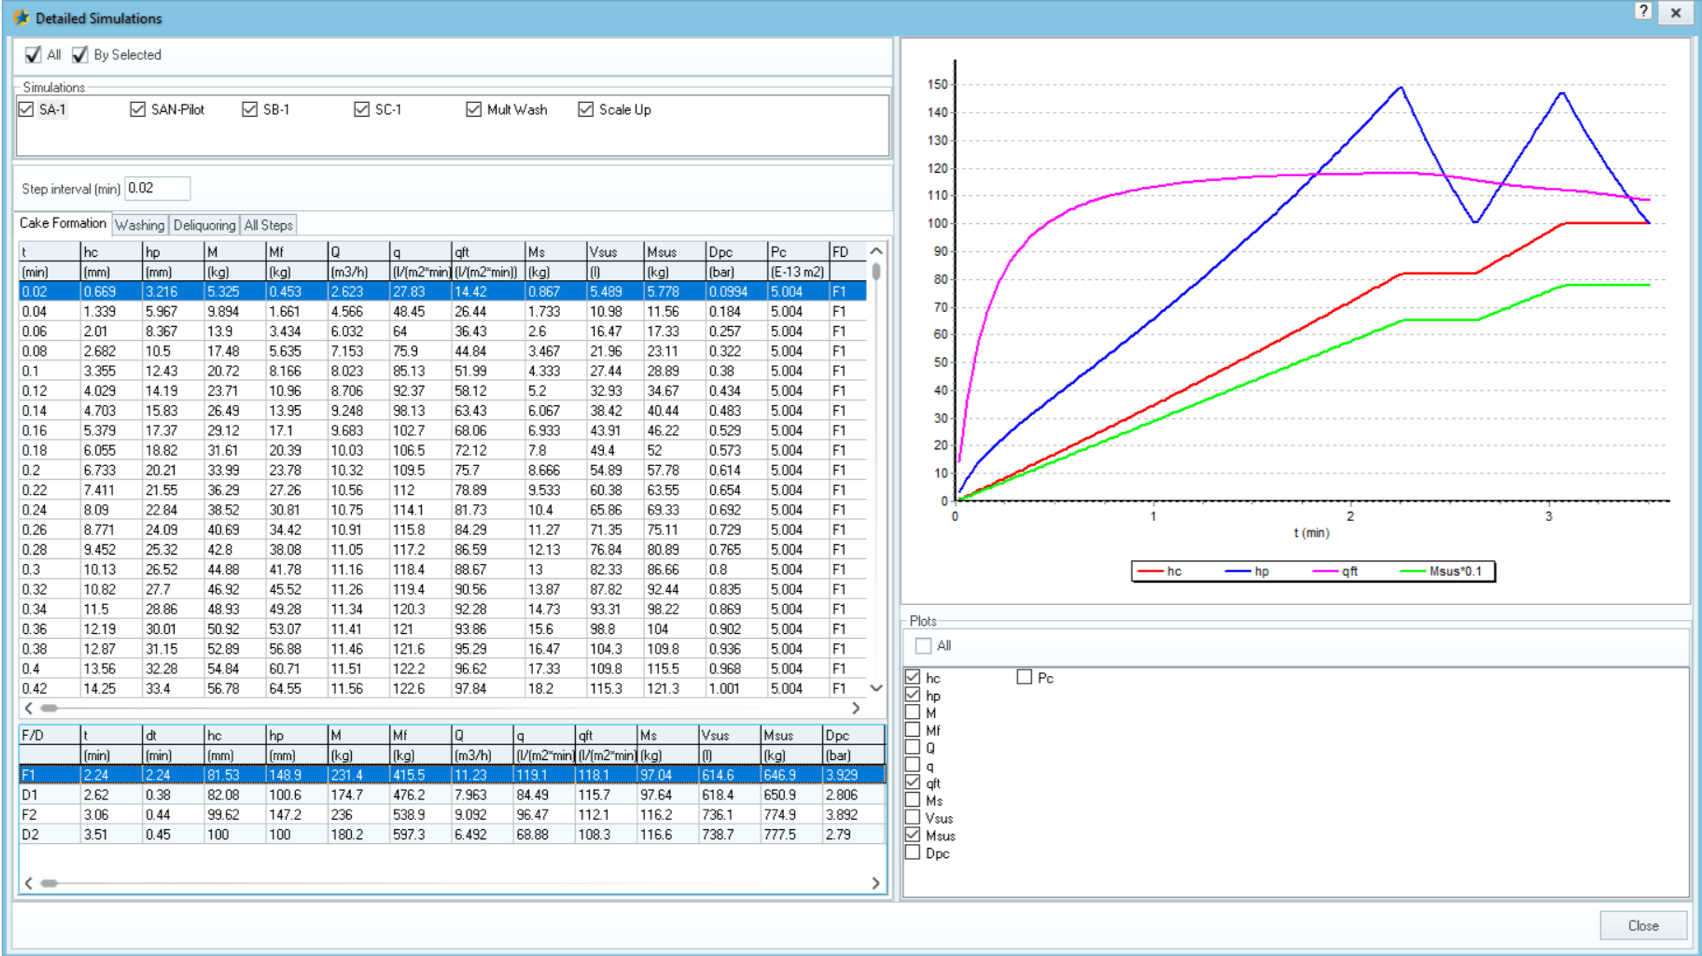
Detailed Simulations window of CENTRISTAR for the cake formation step
Detailed Simulations window of CENTRISTAR for the cake formation step
Displays the values of 12 most important parameters as a function of time as a table from begin up to the end of the cake formation. All of the 12 most important parameters can also be displayed in the diagram. The Detailed Simulation module of CENTRISTAR is among others very helpful to understand, what is going on in the centrifuge from begin up to the end of any step (cake formation, washing, deliquoring) as well as from the begin of the first step (cake formation) up to the end of the last step (the cake deliquoring). The main simulation window shows us only the values for the end of the step. For example, the cake height (hc) at the end of the cake formation time (tf). However, what about the value of hc for each time, from begin until the end of the cake formation? What about the level of the liquid above the cake (hpfrom begin to the end of the cake formation? This question is answered in a user-friendly way by the Detailed Simulation window in a graphical and tabular form.
4/11
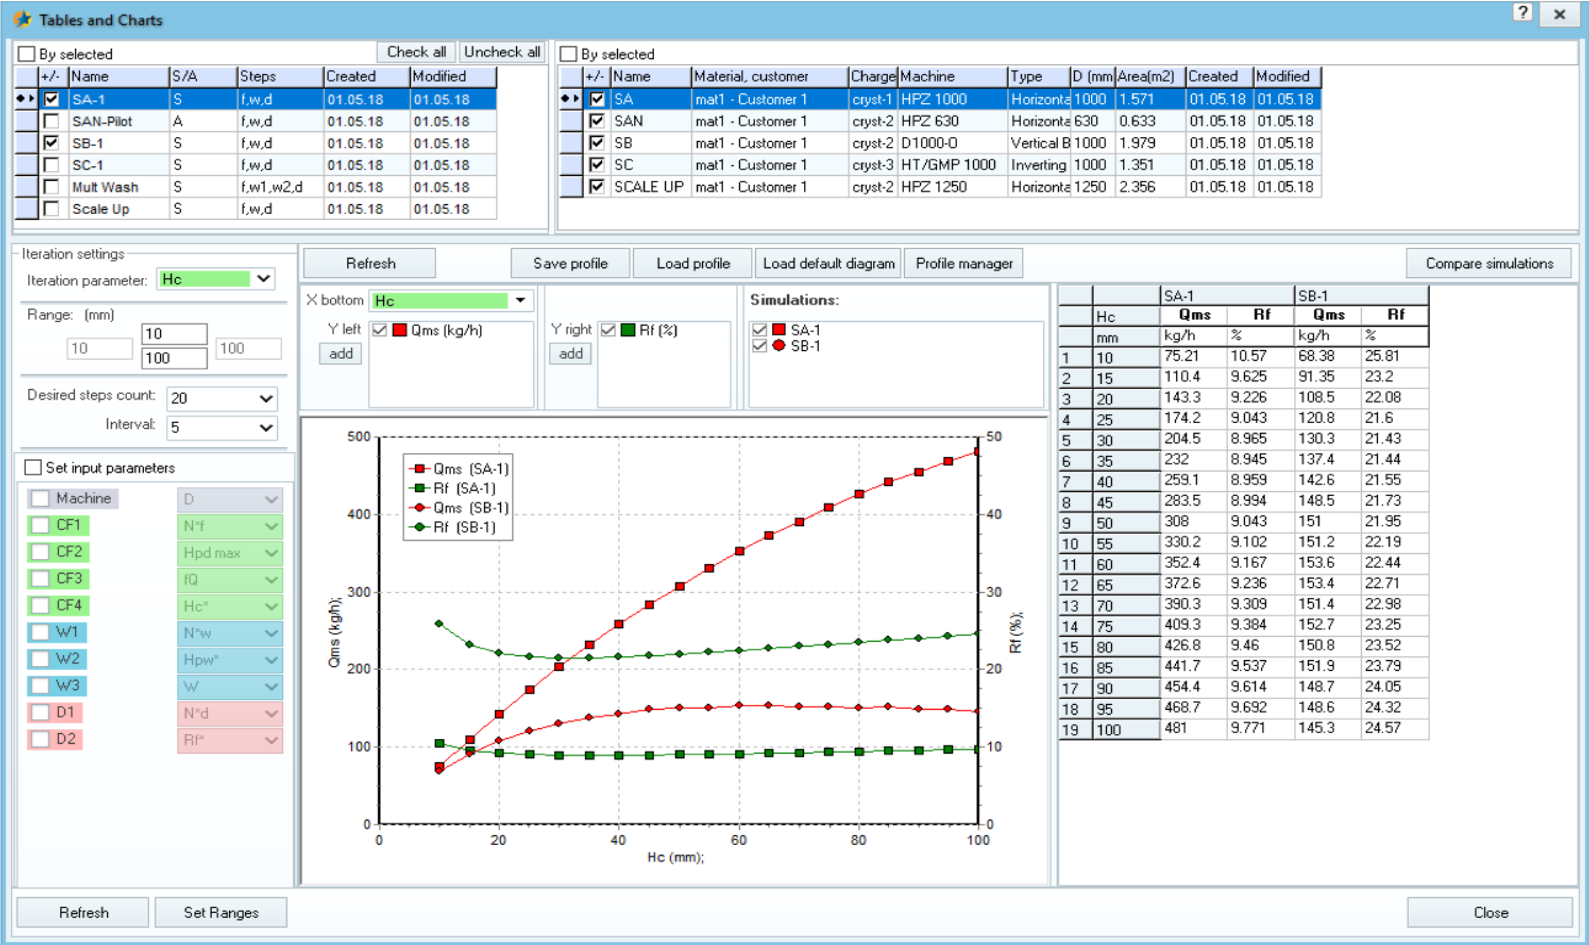
Tables & Charts window of CENTRISTAR
Tables & Charts window of CENTRISTAR
The powerful Tables & Charts window enables the study of the influence of all material, geometrical and setting parameters on the most important result parameters. The results are displayed in form of a diagram and a table. The Tables & Charts window has two options: Iterations only for the current selected simulation or for more than one simulation. Last option allows the performance comparison of a given centrifuge for different material parameters (different suspensions) or for different centrifuge settings and geometrical parameters. Diagram and table can be copied and pasted in Word or Excel. Diagram profiles can be saved (see Save profile button) loaded (Load Profile) and removed from the profiles list (Profile manager). After the selection of a new iteration parameter or new min-max values for the iteration parameter or new number of iterations the Refresh button has to be clicked and the Table & Charts window is adjusted to the new selections after finishing the recalculations.
5/11
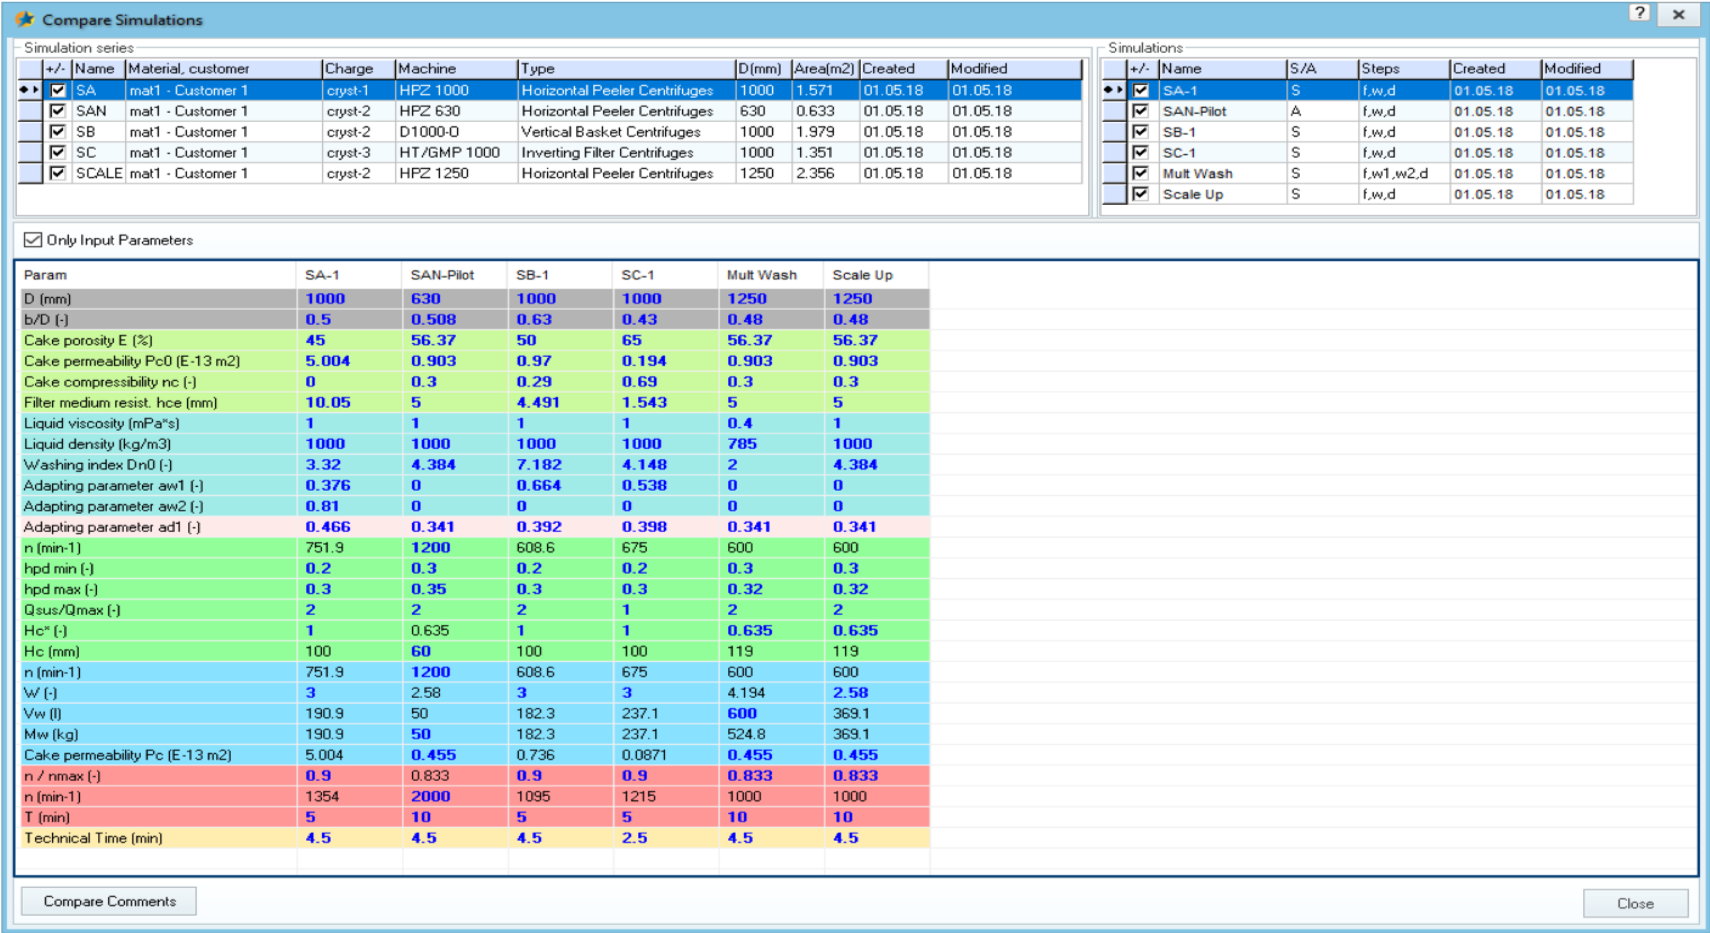
The simulations - comparison window
The simulations - comparison window
In many cases, the user wants to know the differences regarding the inputs or the differences of input and result parameters for definite simulations. The main simulation window does not do that. This is what the Compare –window does. It opens after clicking the Compare button above the simulations list at the right side. By unchecking the Only Input Parameters checkbox not only inputs (in blue color) but also those result parameters are displayed, which at least for one simulation the values are not the same.
6/11
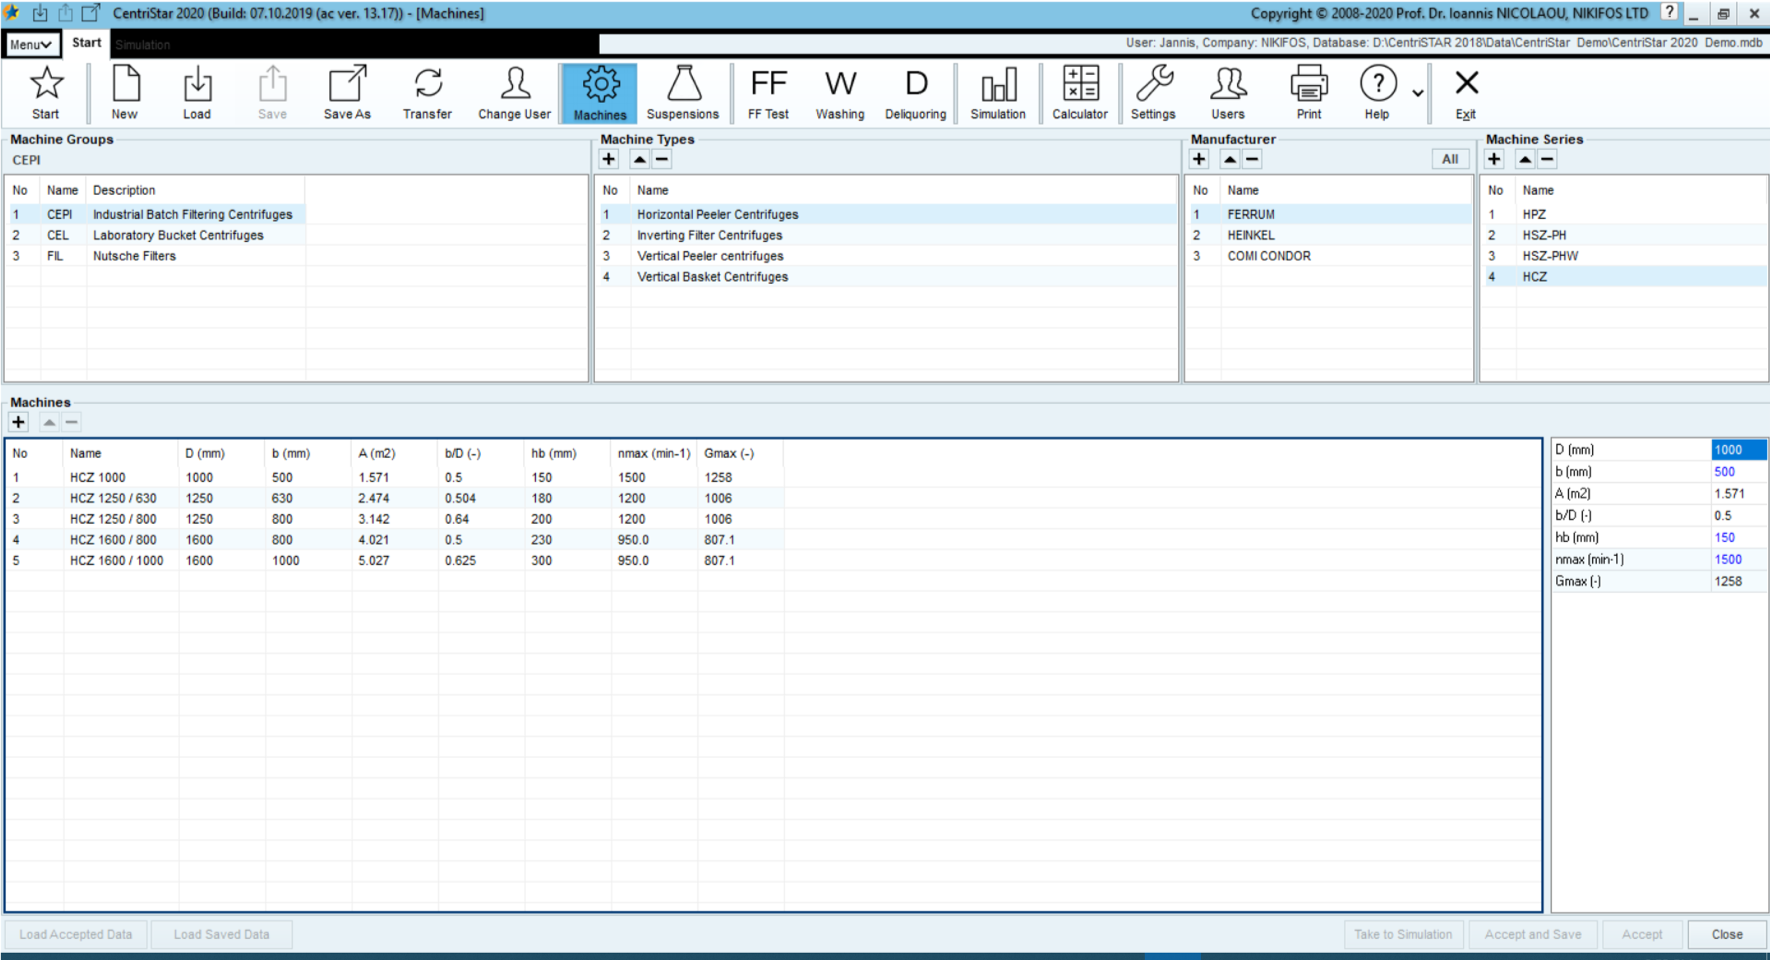
The Machine Database window
The Machine Database window
The Machine database window enables the input and saving of new machines in the machine database, the data changing/deleting of existing machines and the taking of machine data to the Centrifuge Simulation and Data Analysis modules. To enter/modify/select a machine, first the machine group has to be selected. We have 3 machine groups: CEPI, CEL and FIL (CEPI= Pilot and Industrial Centrifuges), CEL=Laboratory Bucket Centrifuges, FIL = Filter Nutsches). The machine groups can not be changed by the User. After selecting the machine group, the machine type from the Machine Types list has to be selected and then the machine Manufacturer. Finally, the machine Series name has to be selected. In the machines list of the selected Machine series we can enter/modify/select a definite machine. Please notice that in case the Machine types or/and Manufacturer or/and Machine Series of the machine we want to enter is not existing in our database, first we have to create this before being able to enter the data of the new machine.
7/11
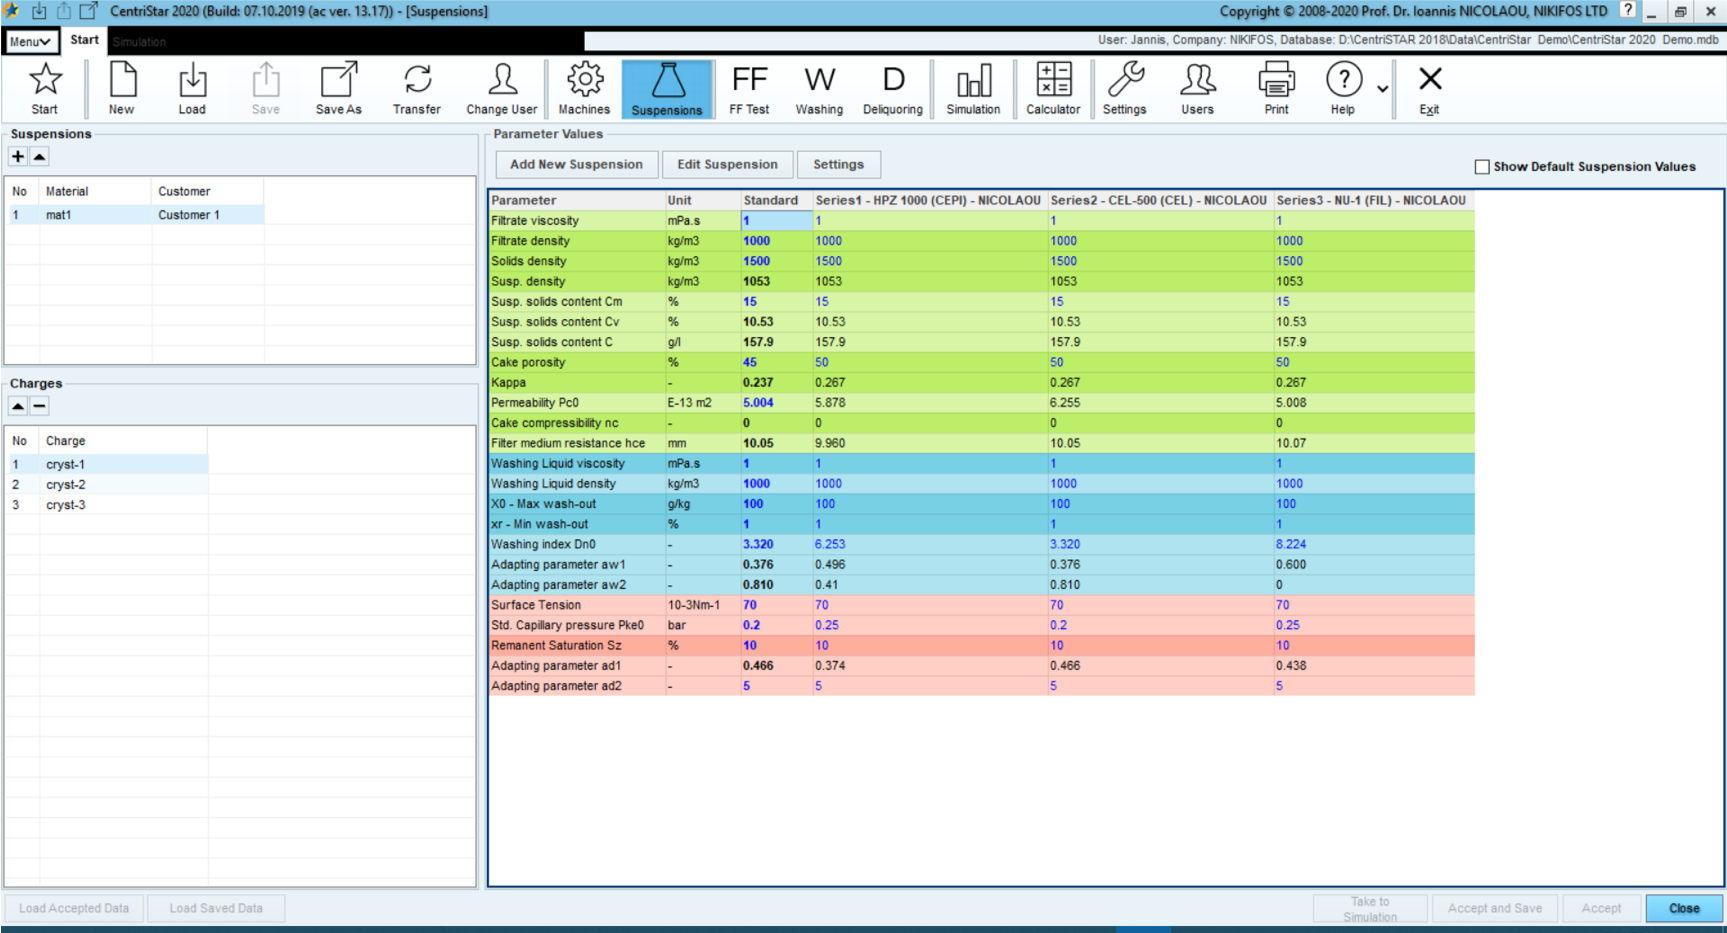
Suspensions database window
Suspensions database window
Each suspension is identified by its name. This name consists of 3 name components: A name for the material, a name for the customer (that is the company or place where this material is produced) and a name for a charge. Each test series has its own column with its own material data. The data, which can be taken to the Simulation module, are only the data in the Standard-column. If we want to use the data of a definite test series for the centrifuge simulation, we first have to paste these data to the standard column via clicking first any cell in this test series and then via mouse right-clicking and selecting Copy All values to Standard. What, if the user has not any experimental results for the selected suspension? The program enables the use of default data for all material parameters. To each of the most important material parameters are assigned five default values: very low, low, middle, high, very high. By clicking the Edit Suspension button a window opens, which enables to take default data to the Standard column of the selected suspension.
8/11
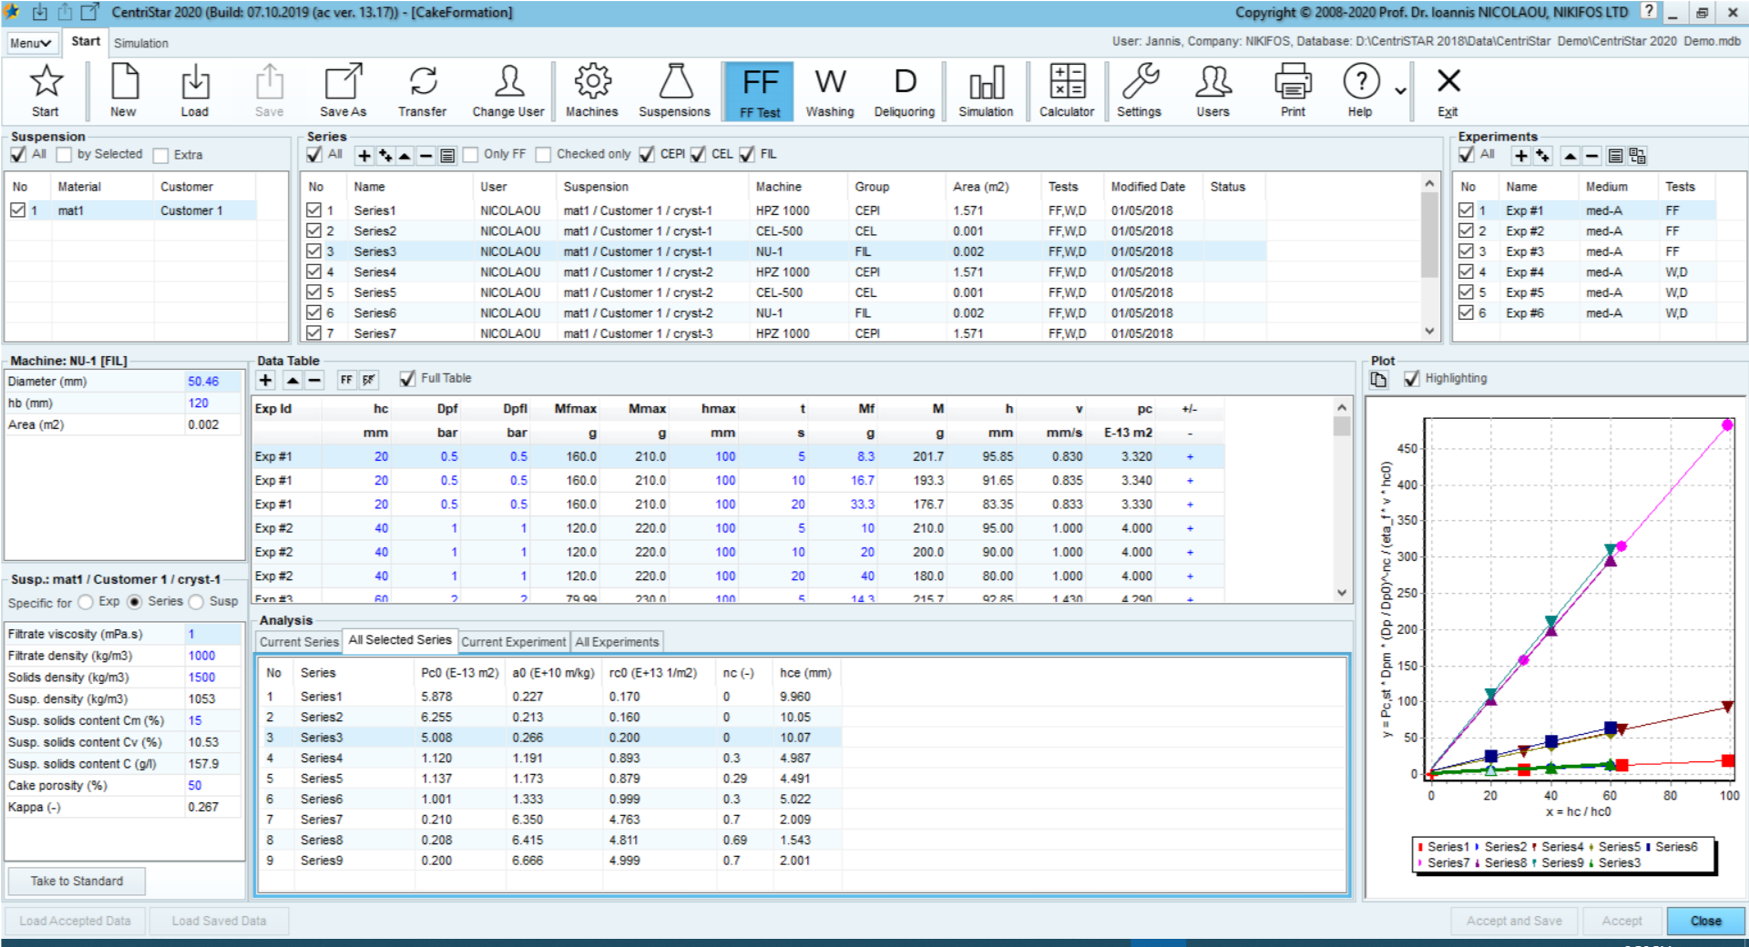
CENTRISTAR window for the analysis of so-called Flow-Through experiments
CENTRISTAR window for the analysis of so-called Flow-Through experiments
Test data from a filter nutsche, from a bucket centrifuge or from a pilot/industrial scale centrifuge can be analyzed and the analysis results can be compared. Main results are the cake permeability (pc0) or the cake resistance (rc0, a0), the cake compressibility (nc) and the specific filter medium resistance (hce). After cake formation, a definite amount of filtrate is given above the cake (Mfmax) of the cake height (hc) and after applying a definite pressure difference (Dp) or a definite rotational speed for centrifuges (n) the time and the corresponding collected filtrate are measured. Instead of the collected amount for a given time, the liquid level can be measured. The determination of the cake compressibility (nc) demands experiments with different pressures (for centrifuges the maximal centrifugal pressure, that is the pressure at the begin of the flow through experiment is calculated and displayed). The determination of the specific filter medium resistance (hce) demands flow – through tests with different cake heights.
9/11
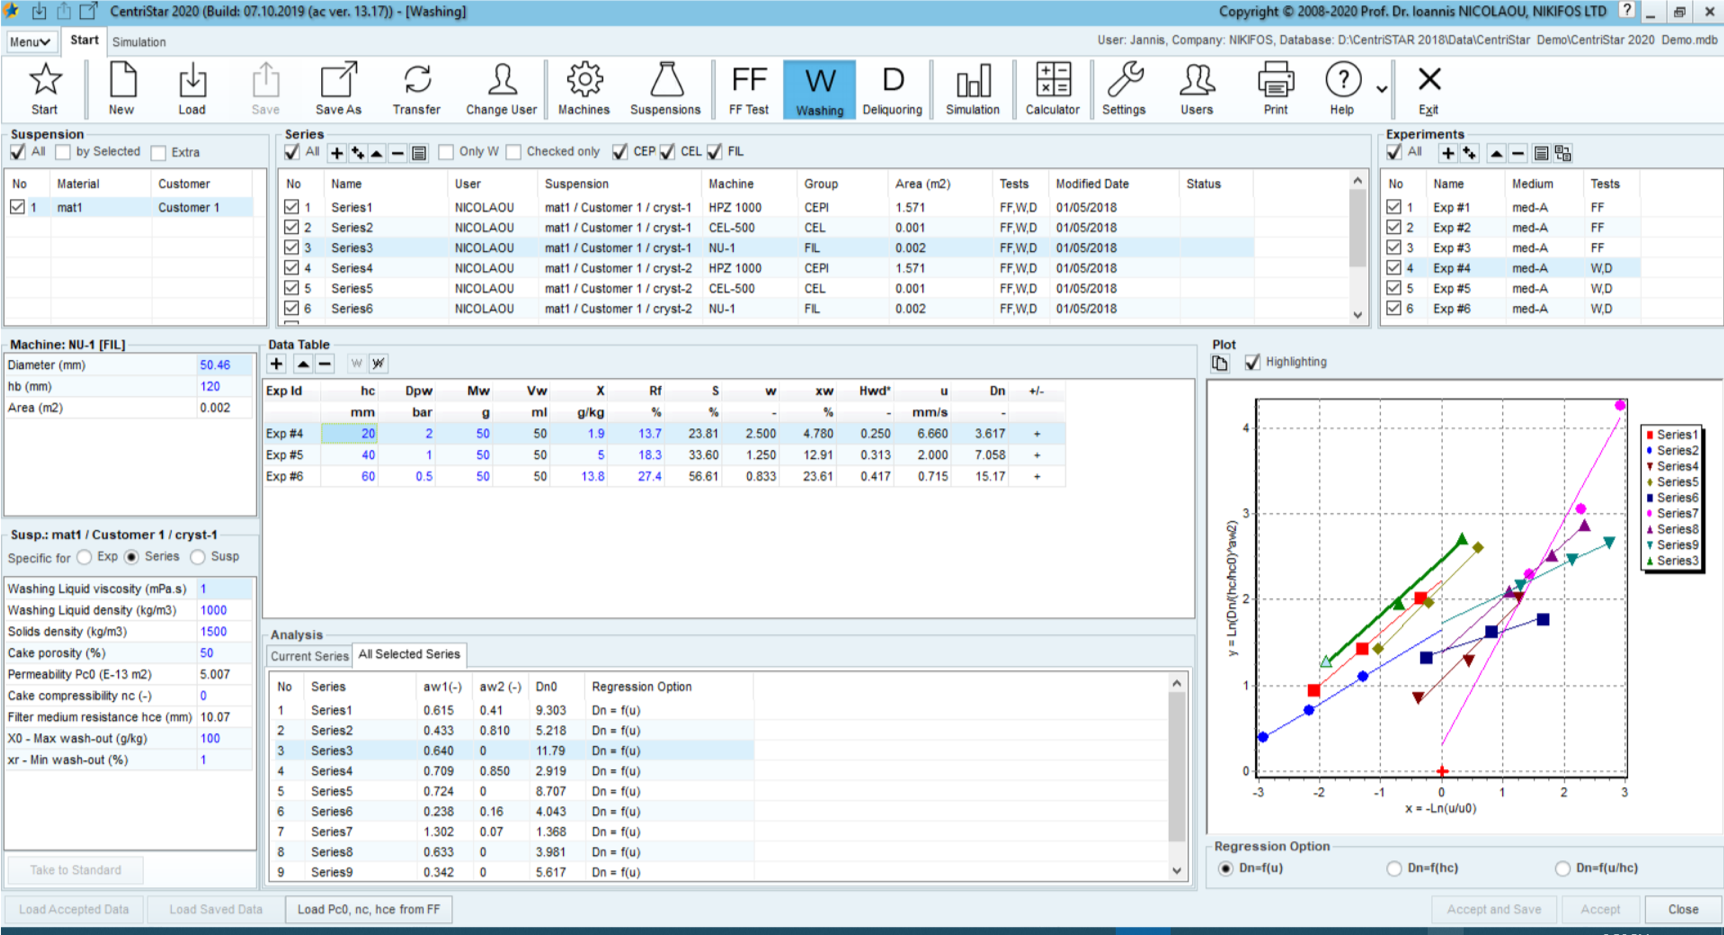
CENTRISTAR window for the analysis of cake washing experiments
CENTRISTAR window for the analysis of cake washing experiments
Test data from a filter nutsche, from a bucket centrifuge or from a pilot/industrial scale centrifuge can be analyzed and the analysis results can be compared. Main results are the washing efficiency parameter (Dn0) and the adaptation parameters aw1 and aw2. Recommended is the analysis option aw1=aw2=aw and in many cases we can make the assumption aw1=aw2=aw=0. Input data for each washing experiment are the cake height (hc), the pressure difference during cake washing for nutsche tests (Dpw) or the rotational speed for centrifuges (nw), the wash liquid mass (Mw) or volume (Vw) given above the cake, the wash out content of the cake at the end of the experiment (X) and the cake moisture content (Rf). The program calculates then for each experiment the cake saturation (S), the washing ratio (w, kinetic parameter of the washing step), the specific wash out content of the cake after finishing the cake washing and before starting the cake deliquoring (xw), the velocity of the wash liquid (u) and the washing efficiency (Dn). The calculated parameters enable the judgment of each experiment.
10/11
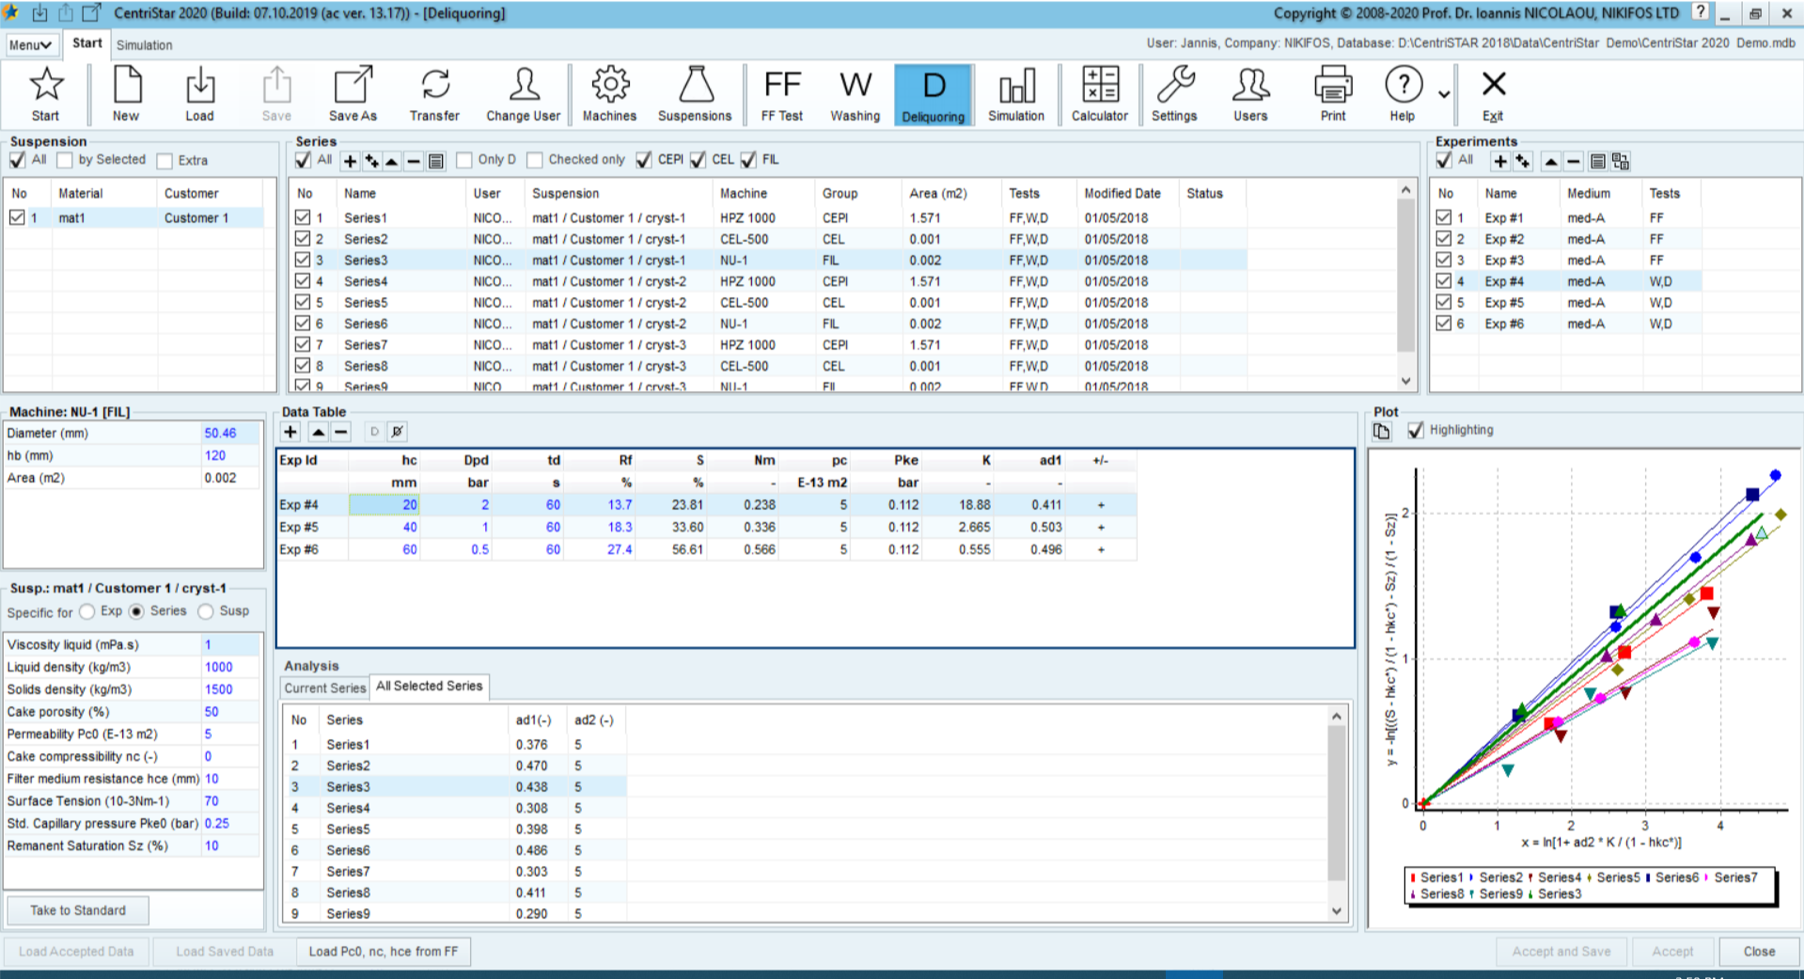
CENTRISTAR window for the analysis of cake deliquoring experiments
CENTRISTAR window for the analysis of cake deliquoring experiments
Test data from a filter nutsche, from a bucket centrifuge or from a pilot/industrial scale centrifuge can be analyzed and the analysis results can be compared. Main results are the adaptation parameters ad1 and ad2. Recommended is the analysis option ad2=5. The determined ad1-value for ad2=5 is defined as the deliquoring efficiency. For each experiment, we need as inputs the cake height (hc), the pressure difference for the filter nutsche experiments (Dpd) or the rotational speed (nd) for the experiments with the bucket or pilot centrifuge, the deliquoring time (td) and the measured cake moisture content (Rf). For every experiment the program calculates and displays the cake Saturation (S), the cake moisture number (Nm), the cake permeability for the given pressure (pc), the capillary pressure (pke), the deliquoring kinetic parameter K and the deliquoring efficiency ad1.
11/11
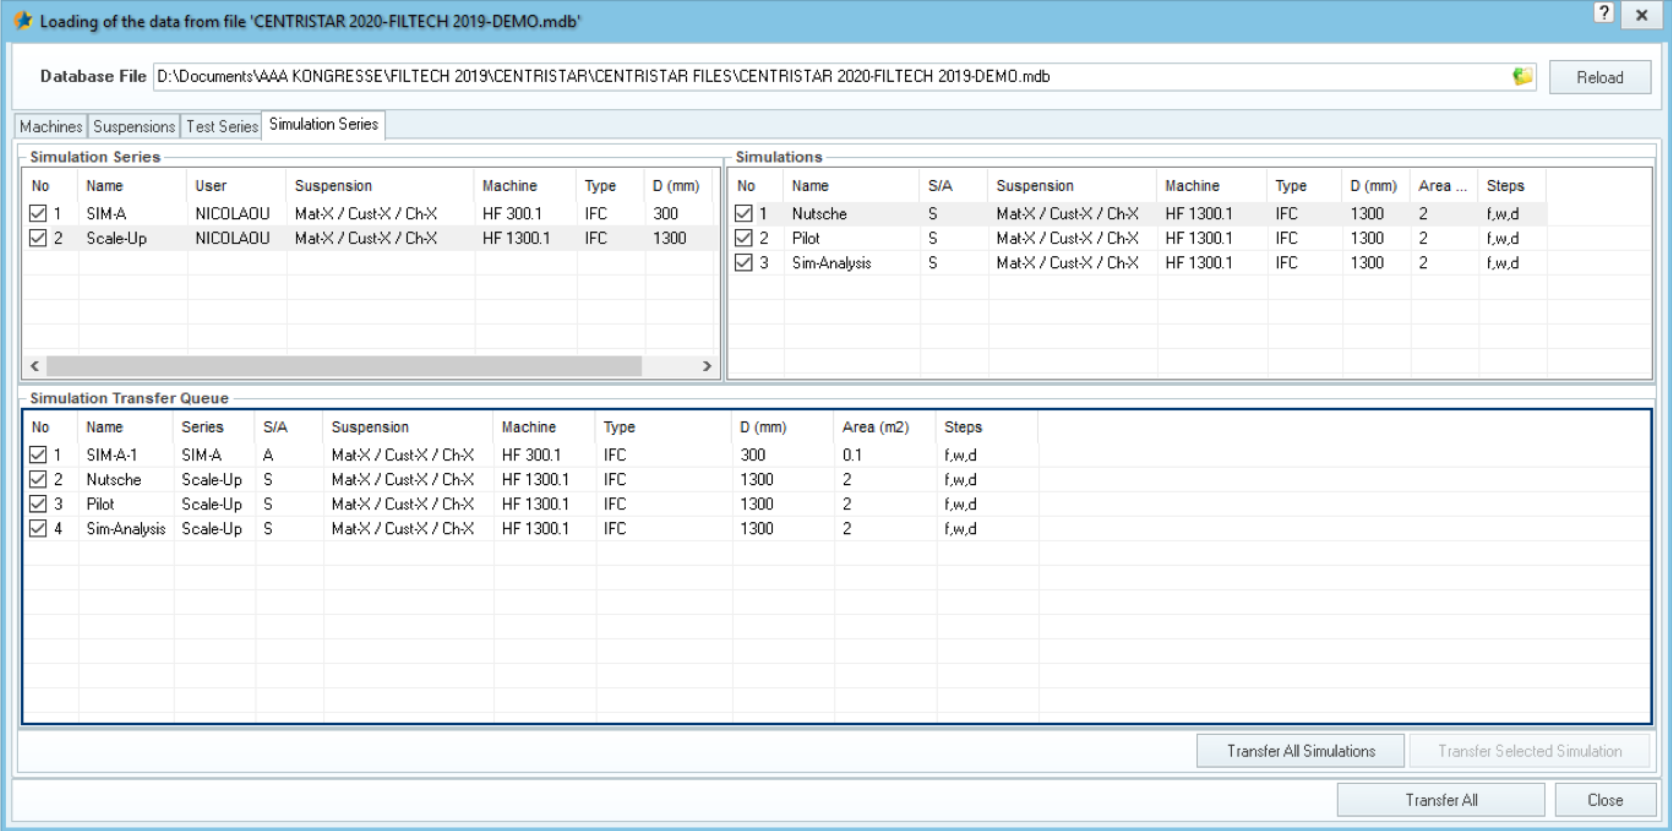
Import Machines-Suspensions-Test Series- Simulation Series from other files to the Current file
Import Machines-Suspensions-Test Series- Simulation Series from other files to the Current file
The User can select any CENTRISTAR file in which he has some data, which he wants to transfer to his current file. Apparatuses,Suspensions, Test Series and Simulation Series can be transferred to the current file. When the same data in both files are existing, the User gets a warning. Due to the Transfer - Tool, the company can have a central database file with the test series and simulations for all projects and all users.
FILASTRA
- Small and very useful modules for important calculations involving all main parameters in cake forming filtration of suspensions
- Saving of all calculations. Highest flexibility regarding input and calculated parameters, units and number of displayed parameters
- A “Must” for all dealing with the filtration of suspensions!
Filter Cake & Suspension Relations – Example for Filter Centrifuges
Filter Cake & Suspension Relations – Example for Candle Filters
Cake Porosity from Test Data
Calculations Cake Formation
Cake Formation Analysis
Cake Moisture Content from Cake Saturation
Cake Washing Parameters
Filter Centrifuges – Calculation of the Centrifugal Pressure
Filter Centrifuges – Calculations to the Filtration Step
1/9
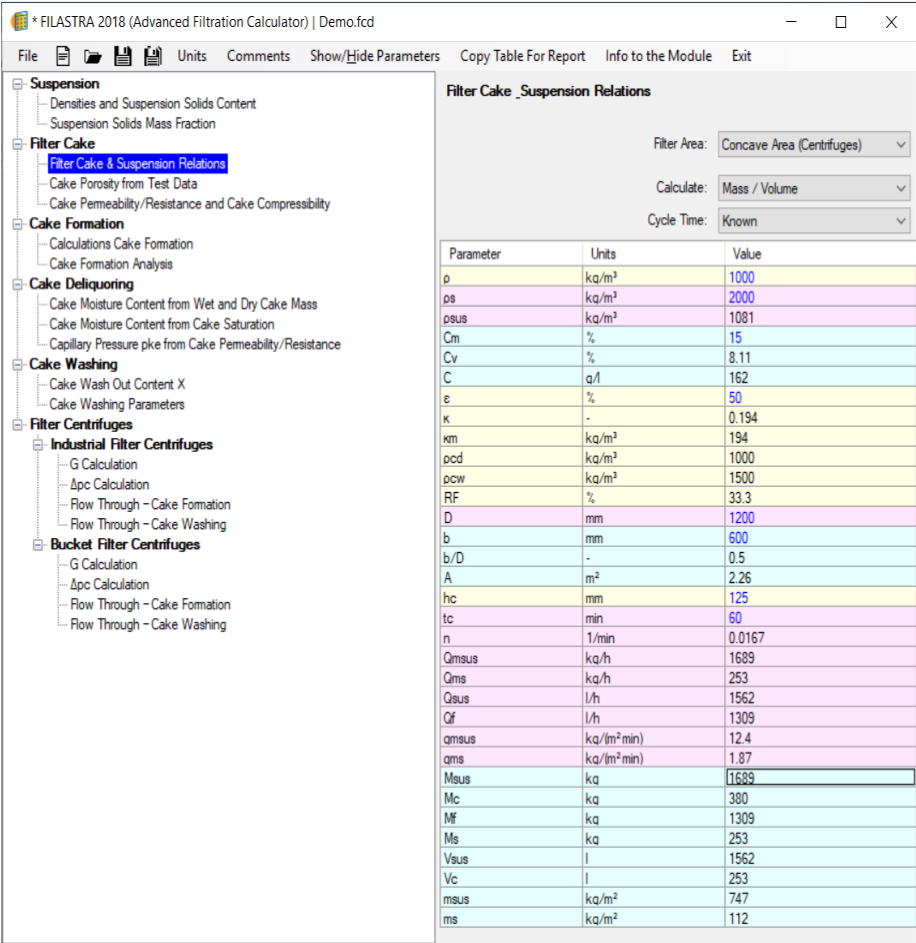
Filter Cake & Suspension Relations – Example for Filter Centrifuges
Filter Cake & Suspension Relations – Example for Filter Centrifuges
For a plane filter area or convex area (candle filters) or concave area (centrifuges): For a given filter area and a given cake height, calculation of the suspension amount per cycle if the solids density, the suspension solids content and the cake porosity are given. Highest flexibility of the calculations: Instead of the suspension amount for one cycle, the cake height or the geometry of the filter or the cake porosity or the suspension solids content or the densities can be calculated (In this example: Calculations for a Filter Centrifuge, with input data in blue color).
2/9
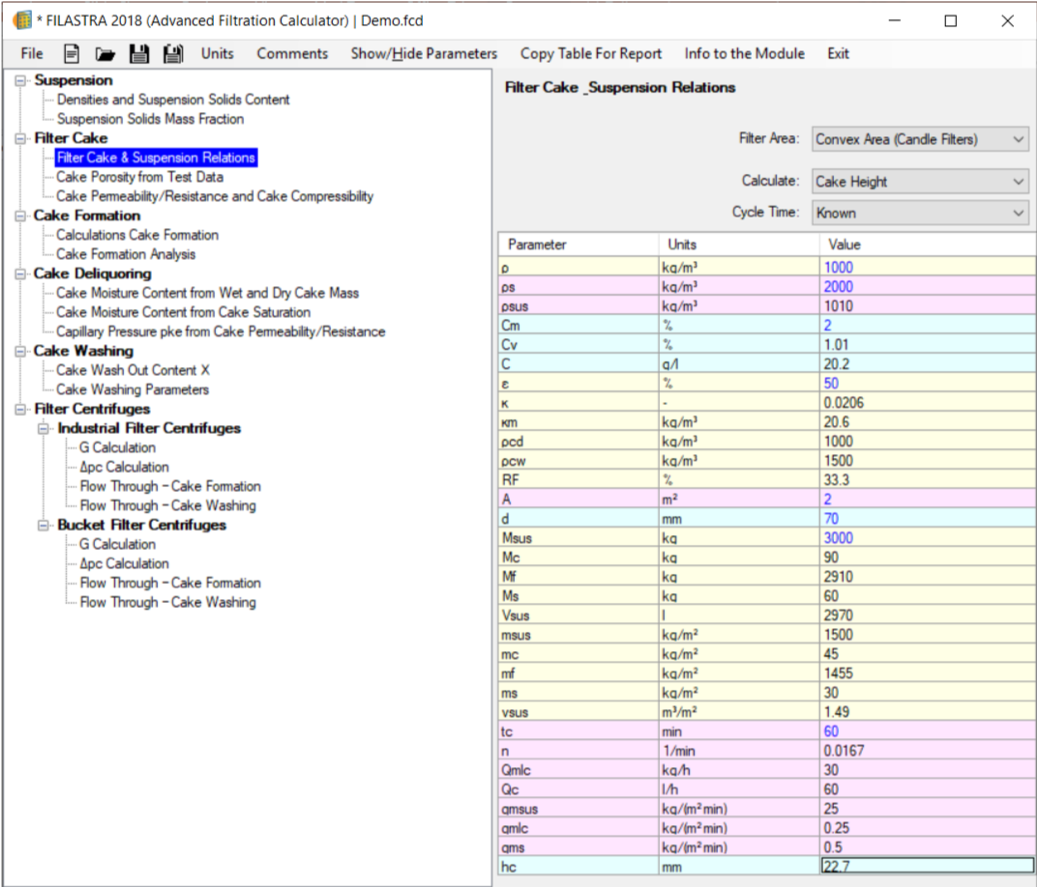
Filter Cake & Suspension Relations – Example for Candle Filters
Filter Cake & Suspension Relations – Example for Candle Filters
For a plane filter area or convex area (candle filters) or concave area (centrifuges): For a given filter area and a given cake height, calculation of the suspension amount per cycle if the solids density, the suspension solids content and the cake porosity are given. Highest flexibility of the calculations: Instead of the suspension amount for one cycle, the cake height or the geometry of the filter or the cake porosity or the suspension solids content or the densities can be calculated (In this example: Calculations for a Candle Filter, with input data in blue color).
3/9
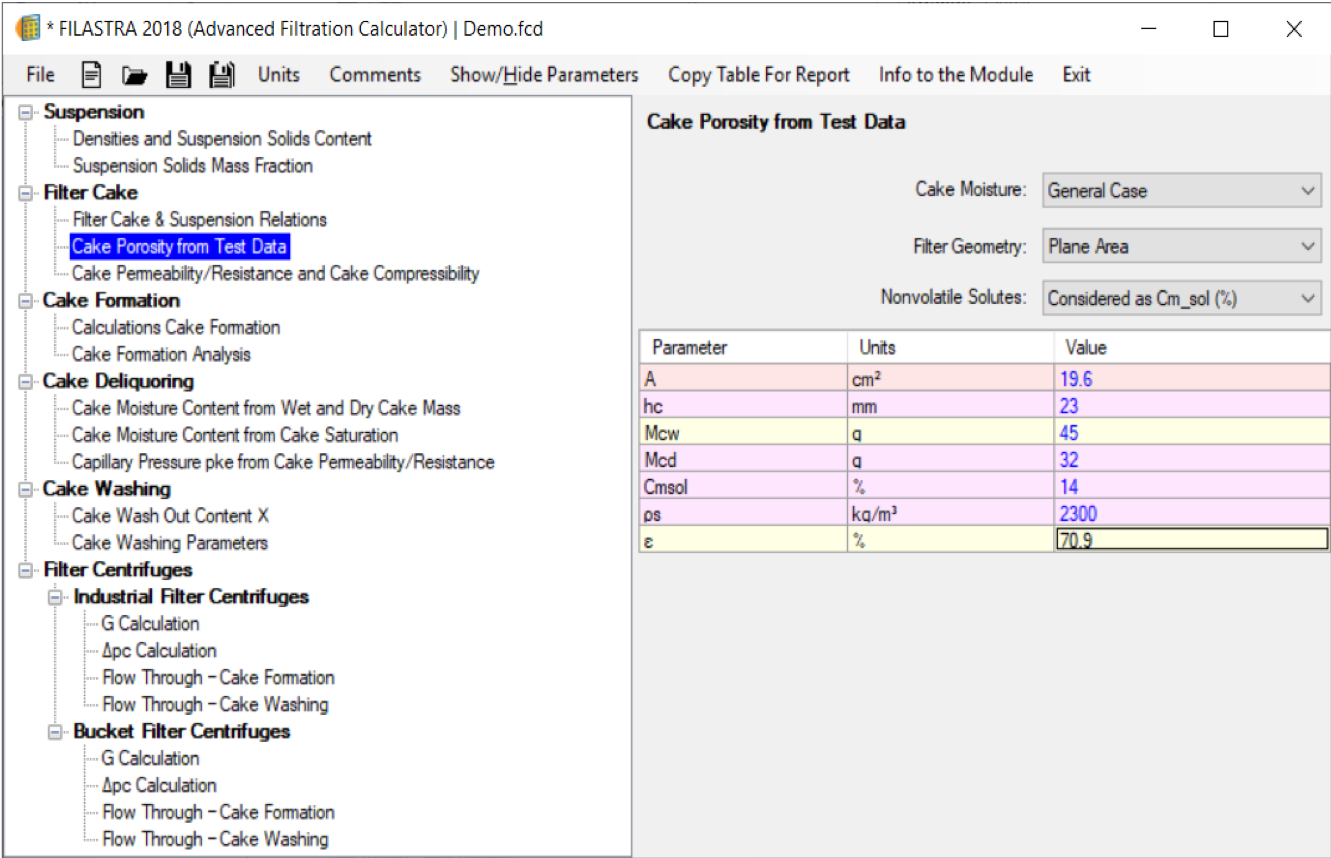
Cake Porosity from Test Data
Cake Porosity from Test Data
Calculation of the cake porosity from tests with filters with plane or convex or concave filter area under consideration of nonvolatile solutes in the cake liquid. Two options: Saturated cake (all voids filled with liquid) and non saturated cake are considered.
4/9
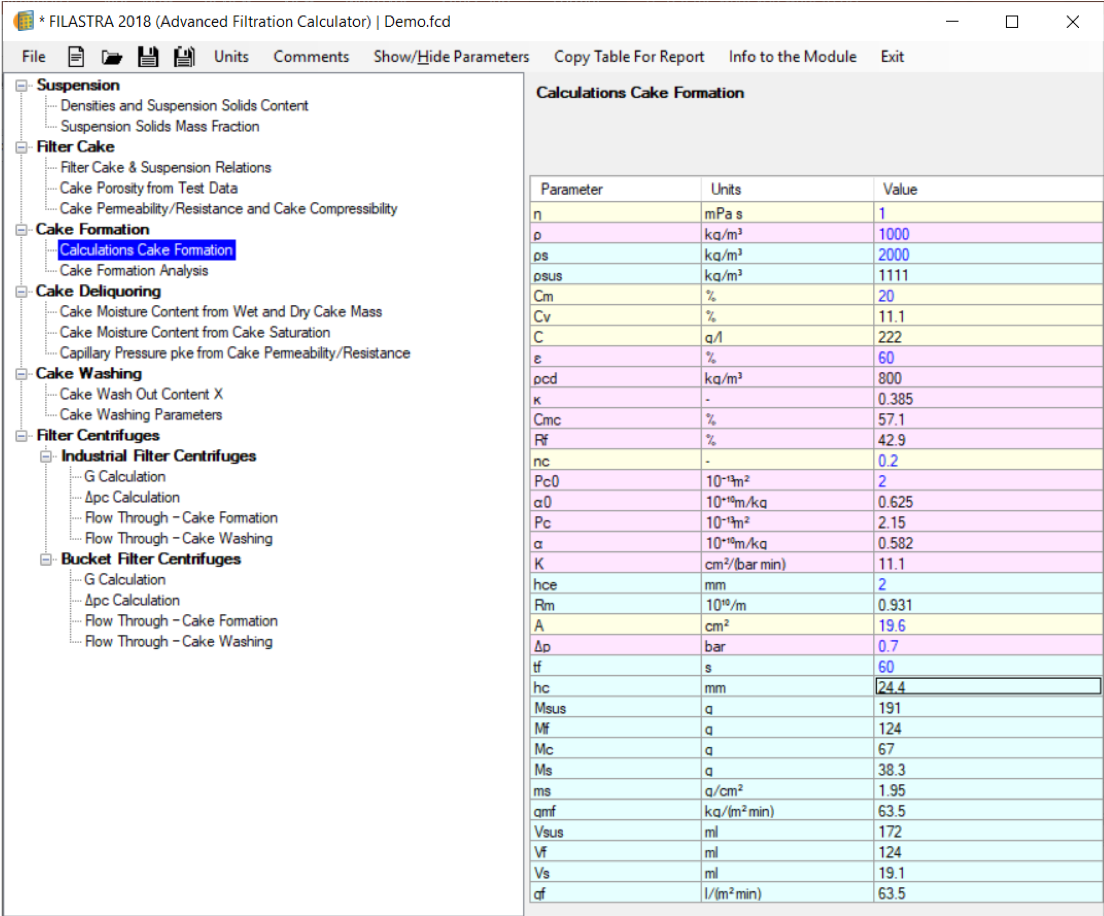
Calculations Cake Formation
Calculations Cake Formation
Calculation of the filtration time for given suspension and cake parameters (viscosity and density of mother liquid, density of solids or suspension, solids content as mass or volume fraction or concentration, standard cake permeability/cake resistance, cake compressibility and filter medium resistance), for a given pressure difference and a given cake height. Alternatively the cake height or the amount of suspension Msus/Vsus can be calculated.
5/9
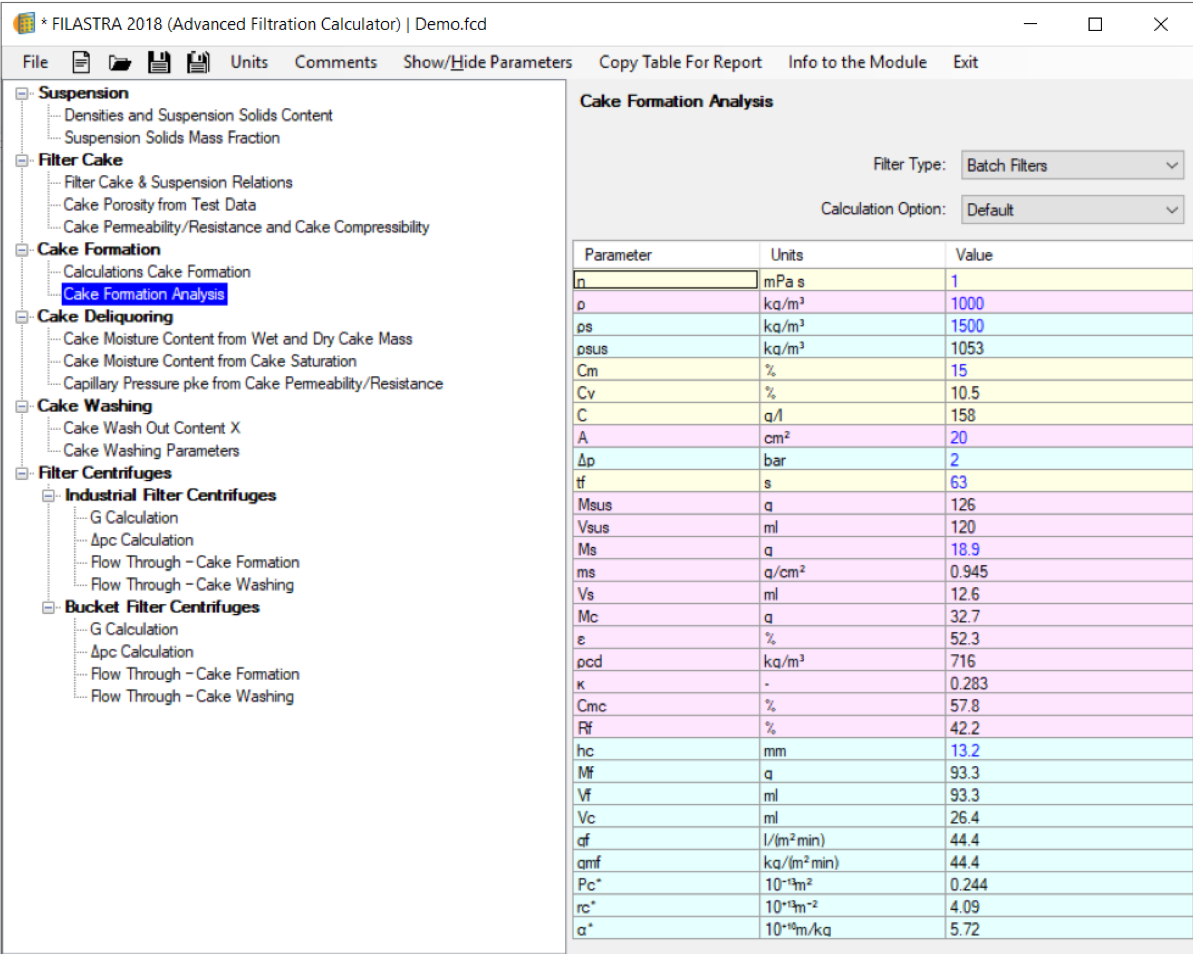
Cake Formation Analysis
Cake Formation Analysis
It determines from one experiment (batch or continuous filter) both parameters: cake porosity and cake permeability/cake resistance with the highest flexibility regarding the input parameters. This module can be also used to simulate the performance of batch and continuous filters if the porosity and permeability of the cake are entered instead of calculated.
6/9
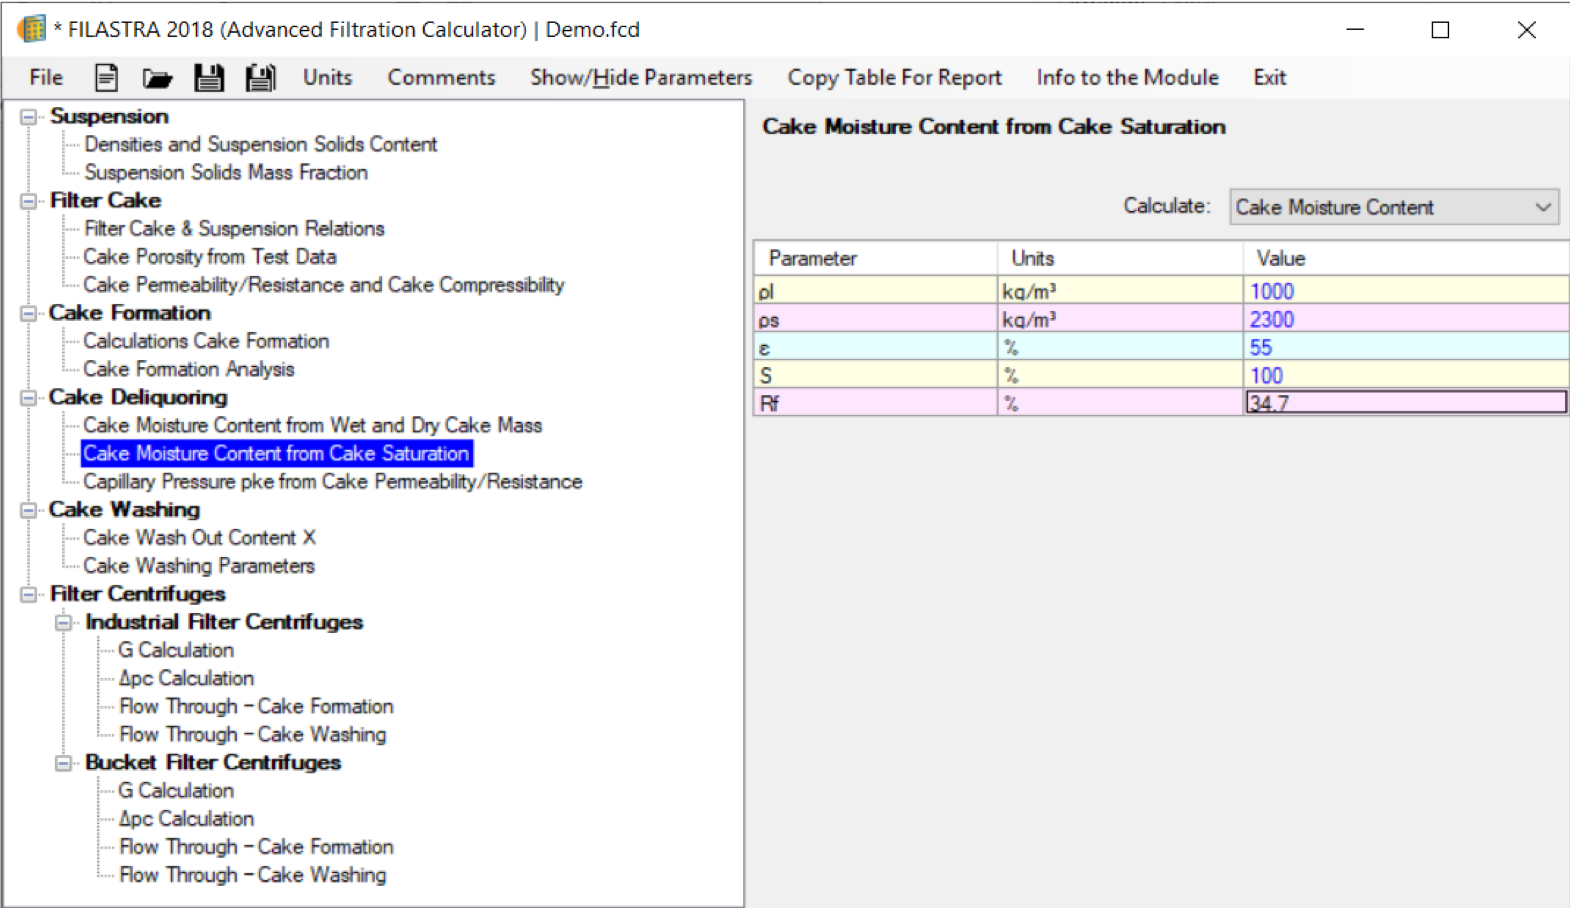
Cake Moisture Content from Cake Saturation
Cake Moisture Content from Cake Saturation
Calculation of the cake moisture content from the cake porosity and the cake saturation. Alternatively the cake saturation can be calculated if the cake moisture content and the cake porosity are entered or the cake porosity can be determined if the cake saturation and the cake moisture content are given.
7/9
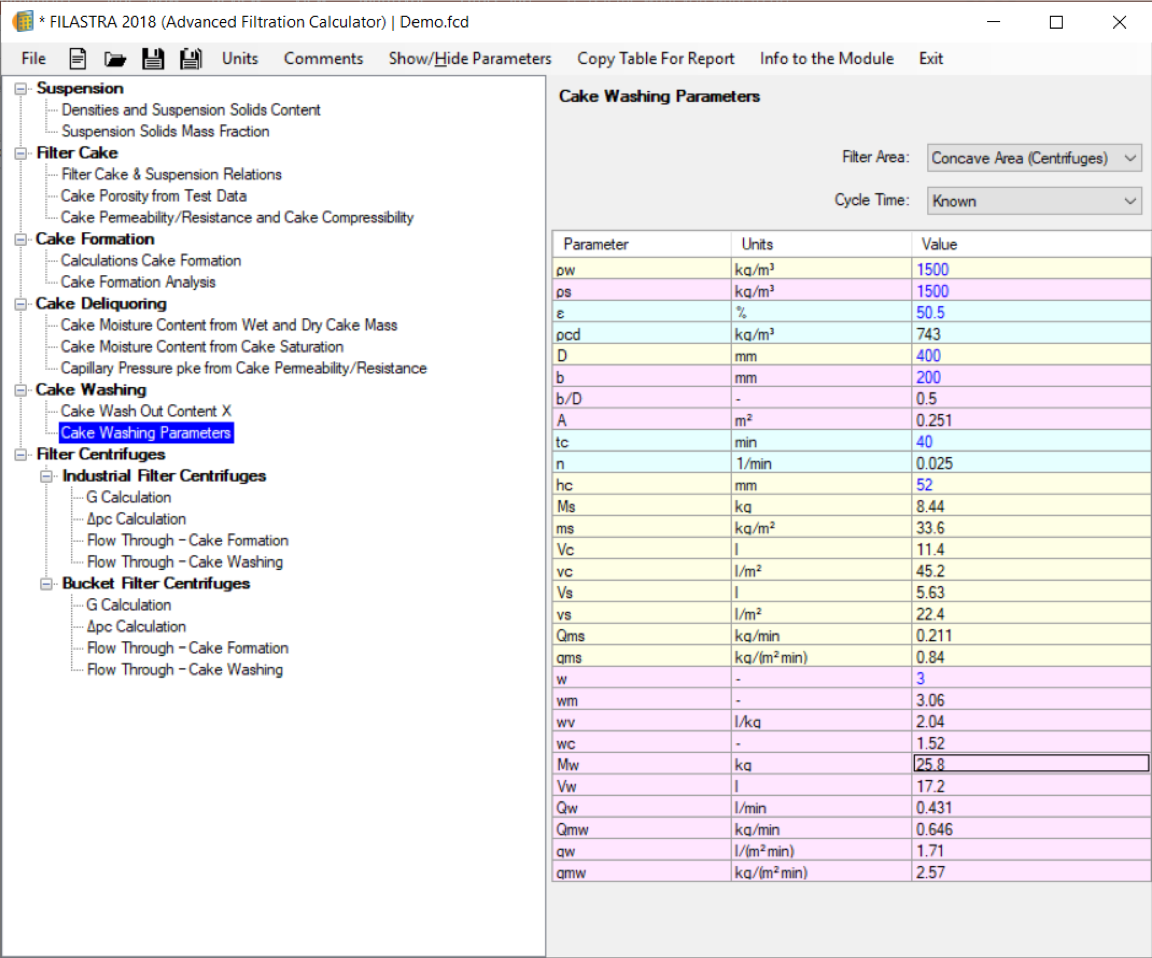
Cake Washing Parameters
Cake Washing Parameters
For Filters and Filter Centrifuges determination of the needed washing liquid amount (specific and absolute). Needed inputs are filter geometry parameters, liquid and solids density, cake porosity and cake height.
8/9
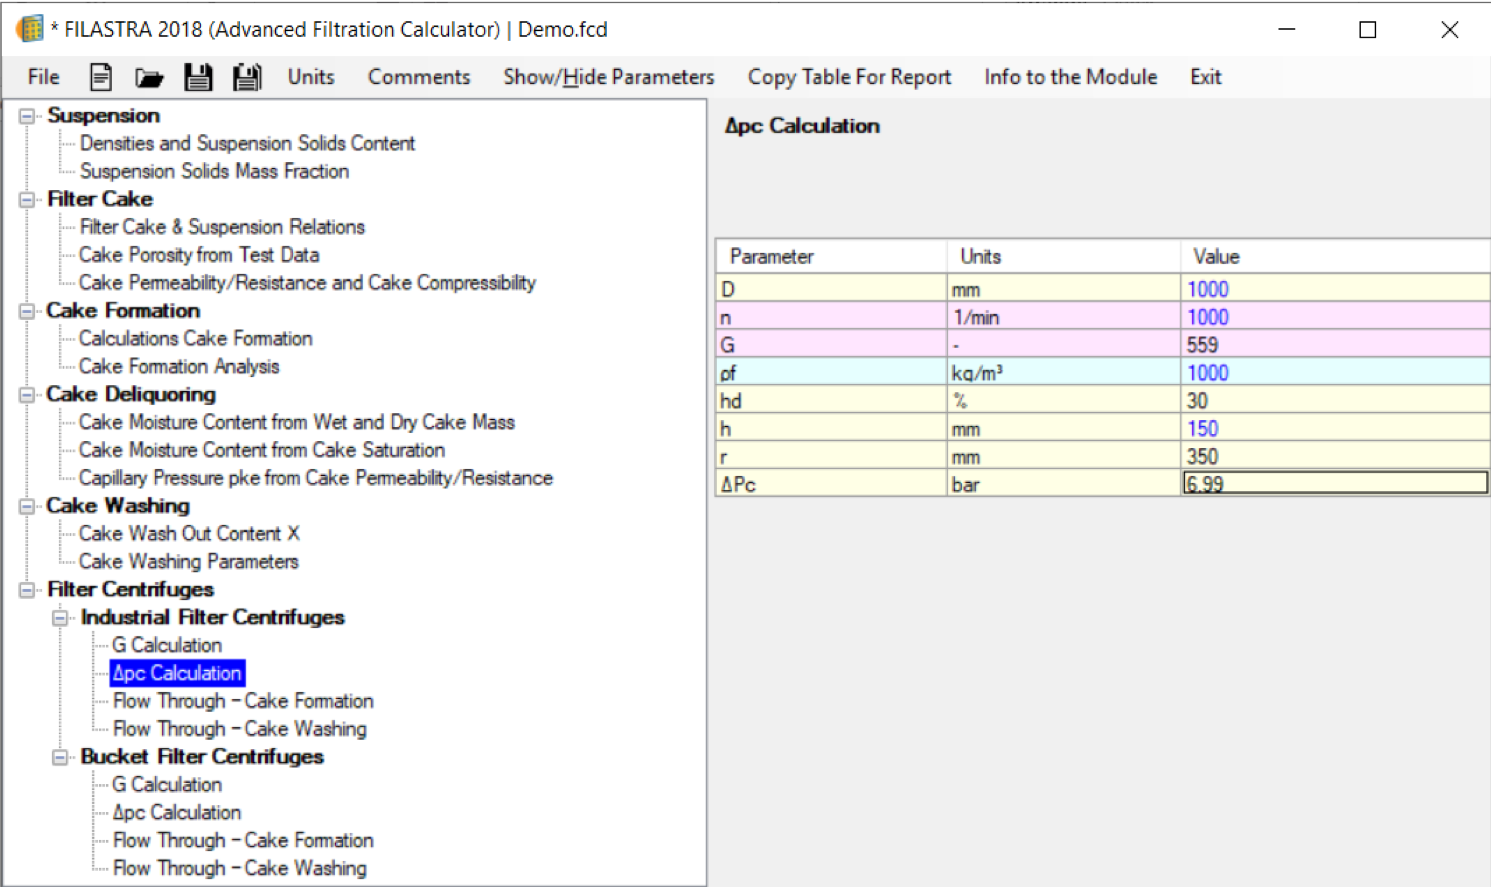
Filter Centrifuges – Calculation of the Centrifugal Pressure
Filter Centrifuges – Calculation of the Centrifugal Pressure
Calculation of the Centrifugal Pressure for the filtration step in Filter Centrifuges. Default Inputs are the centrifuge diameter, the rotational speed, the liquid density and the liquid pool height.
9/9
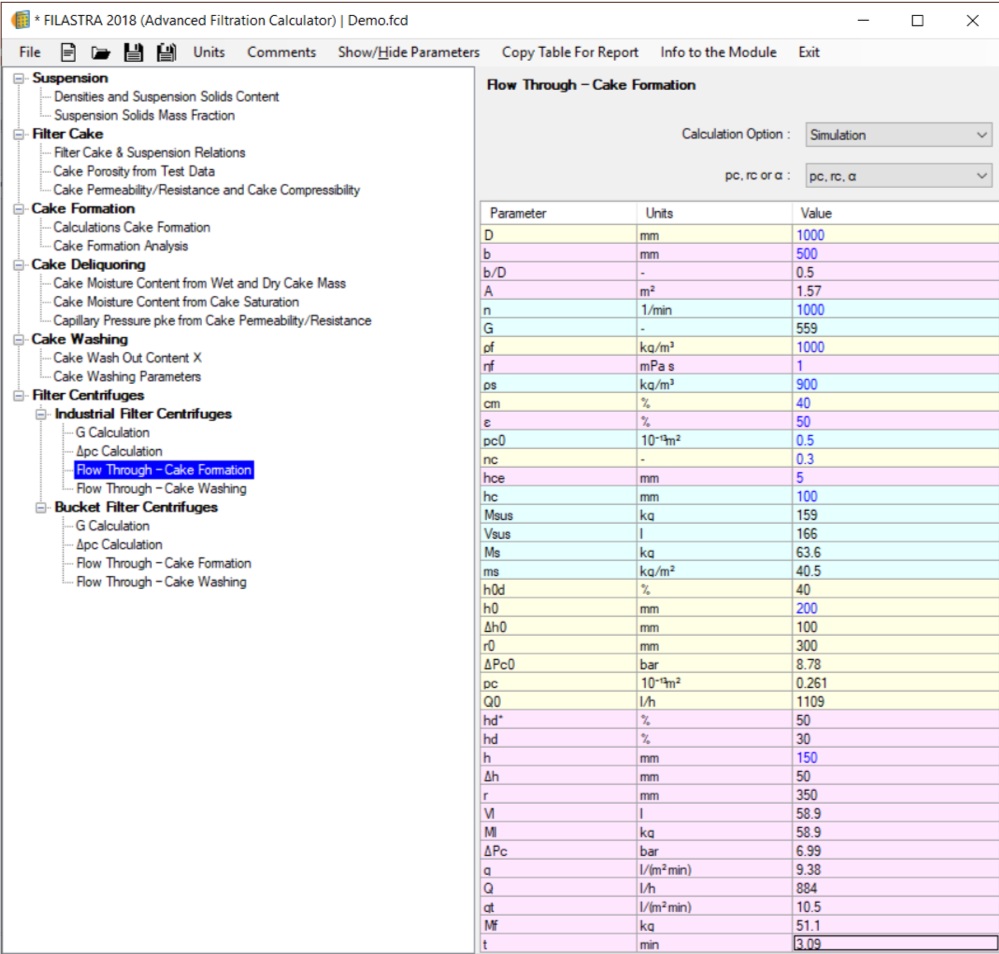
Filter Centrifuges – Calculations to the Filtration Step
Filter Centrifuges – Calculations to the Filtration Step
Calculation of the necessary filtrate drainage time during the cake formation step in the filter centrifuge, so that the filtrate pool height reaches the level h<h0 (with h0 the filtrate liquid pool height at t=0) and if additionally the following parameters are given: Centrifuge diameter, rotational speed, density and viscosity of the filtrate, cake permeability/cake resistance, filter medium resistance and cake height.
CYCLONPLUS
-
Hydrocyclone Performance Calculation and Design
Practice oriented, theory and experiment based, user friendly and reliable calculation of the performance of one or more hydrocyclones in parallel connection for any given suspension, constructive and setting parameters. Design of the hydrocyclone diameter and the number of hydrocyclones in parallel connection for a given performance.
-
Test Data Analysis
Theory based analysis of experimental data from laboratory, pilot or industrial Cyclones with a reliable and user-friendly determination of all adaptation parameters, which are necessary for the Design and performance calculation of Hydrocyclones.
-
Database for Hydrocyclones
The name and geometrical data of any hydrocyclone can be entered and saved in the window of the Cyclones database module. Every hydrocyclone belongs to a definite cyclone series and every series to a definite manufacturer and definite application.
-
Database for Suspensions
Every suspension can be entered and saved in the window of the suspensions database module. Each suspension is characterized by names for material, customer and charge as well as values for the parameters, which are needed for the analysis of cyclone test data and the design and performance calculation of hydrocyclones.
Simulation of the performance of a Hydrocyclone Unit (Standard Simulation Option)
Design option of the Simulation module
Tables & Charts window for the Simulation module
Particle size distribution by mass for the feed, the overflow and the underflow
Main window of the Analysis module
Database window for the Hydrocyclones
Database window for the Suspensions
1/7
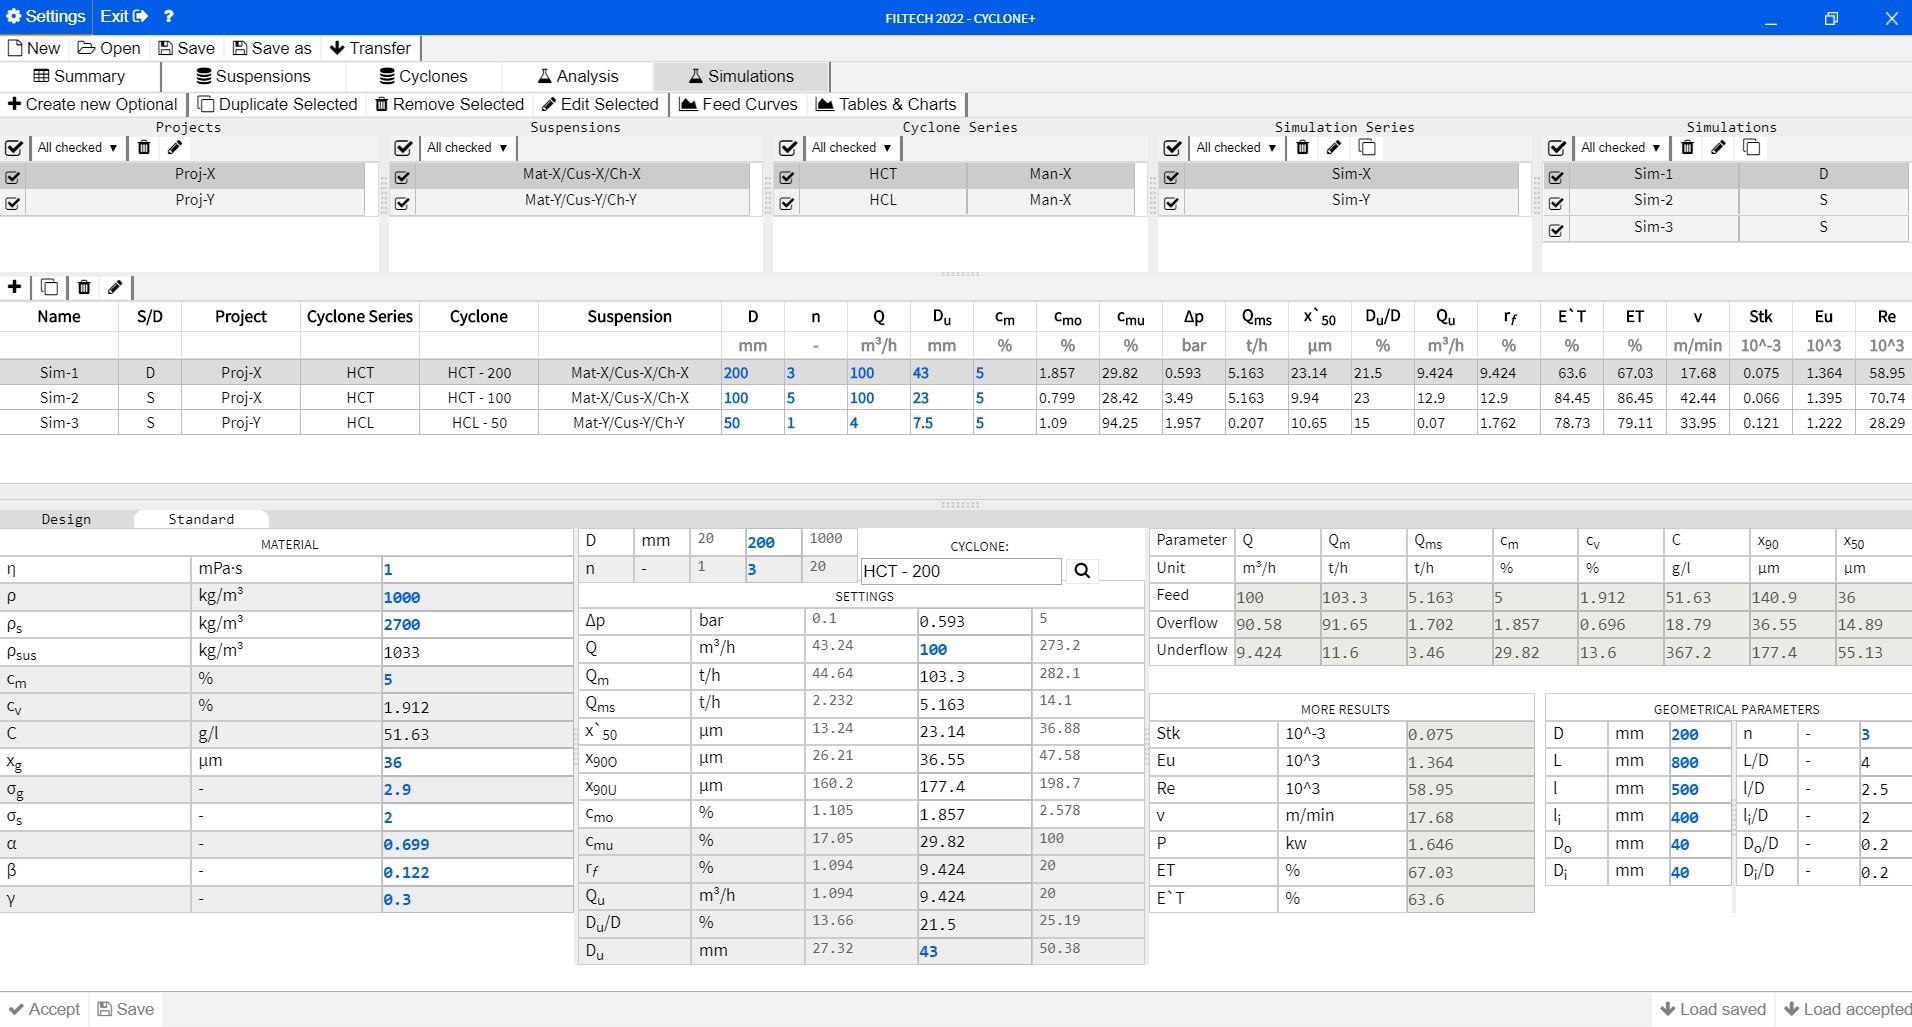
Simulation of the performance of a Hydrocyclone Unit (Standard Simulation Option)
Simulation of the performance of a Hydrocyclone Unit (Standard Simulation Option)
Standard simulation option. That means, beside the material parameters, the diameter and the number of cyclones in parallel connection are given as well as another two parameters in the settings field. In this settings field we have two groups of parameters. Any parameter of this group can be entered and all other parameters are calculated. In this example, in the first group the feed volume flow rate (Q) and in the second group the underflow diameter (Du) are entered. Calculated parameters are then, among others, the pressure drop (δp), the cut size (x’50) and the overflow solids mass content cmo. In the second group we have as calculated parameters the solids mass content in the underflow (cmu) and the absolute and specific underflow volume flow rate (Qu, rf). Min-max values for every input/calculated parameter in the settings field are calculated and displayed enabling the input only of possible values.
For every simulation the mass and volume flow rates as well as solids content for the feed, the overflow and underflow are calculated and displayed in a table together enabling an easy comparison. Furthermore, for every simulation the particle size distributions curves for overflow and underflow are calculated and can be displayed together with the feed curve in form of tables and graphs. For every simulation, the grade efficiency curves are also determined and can be displayed in form of table and graph.
2/7
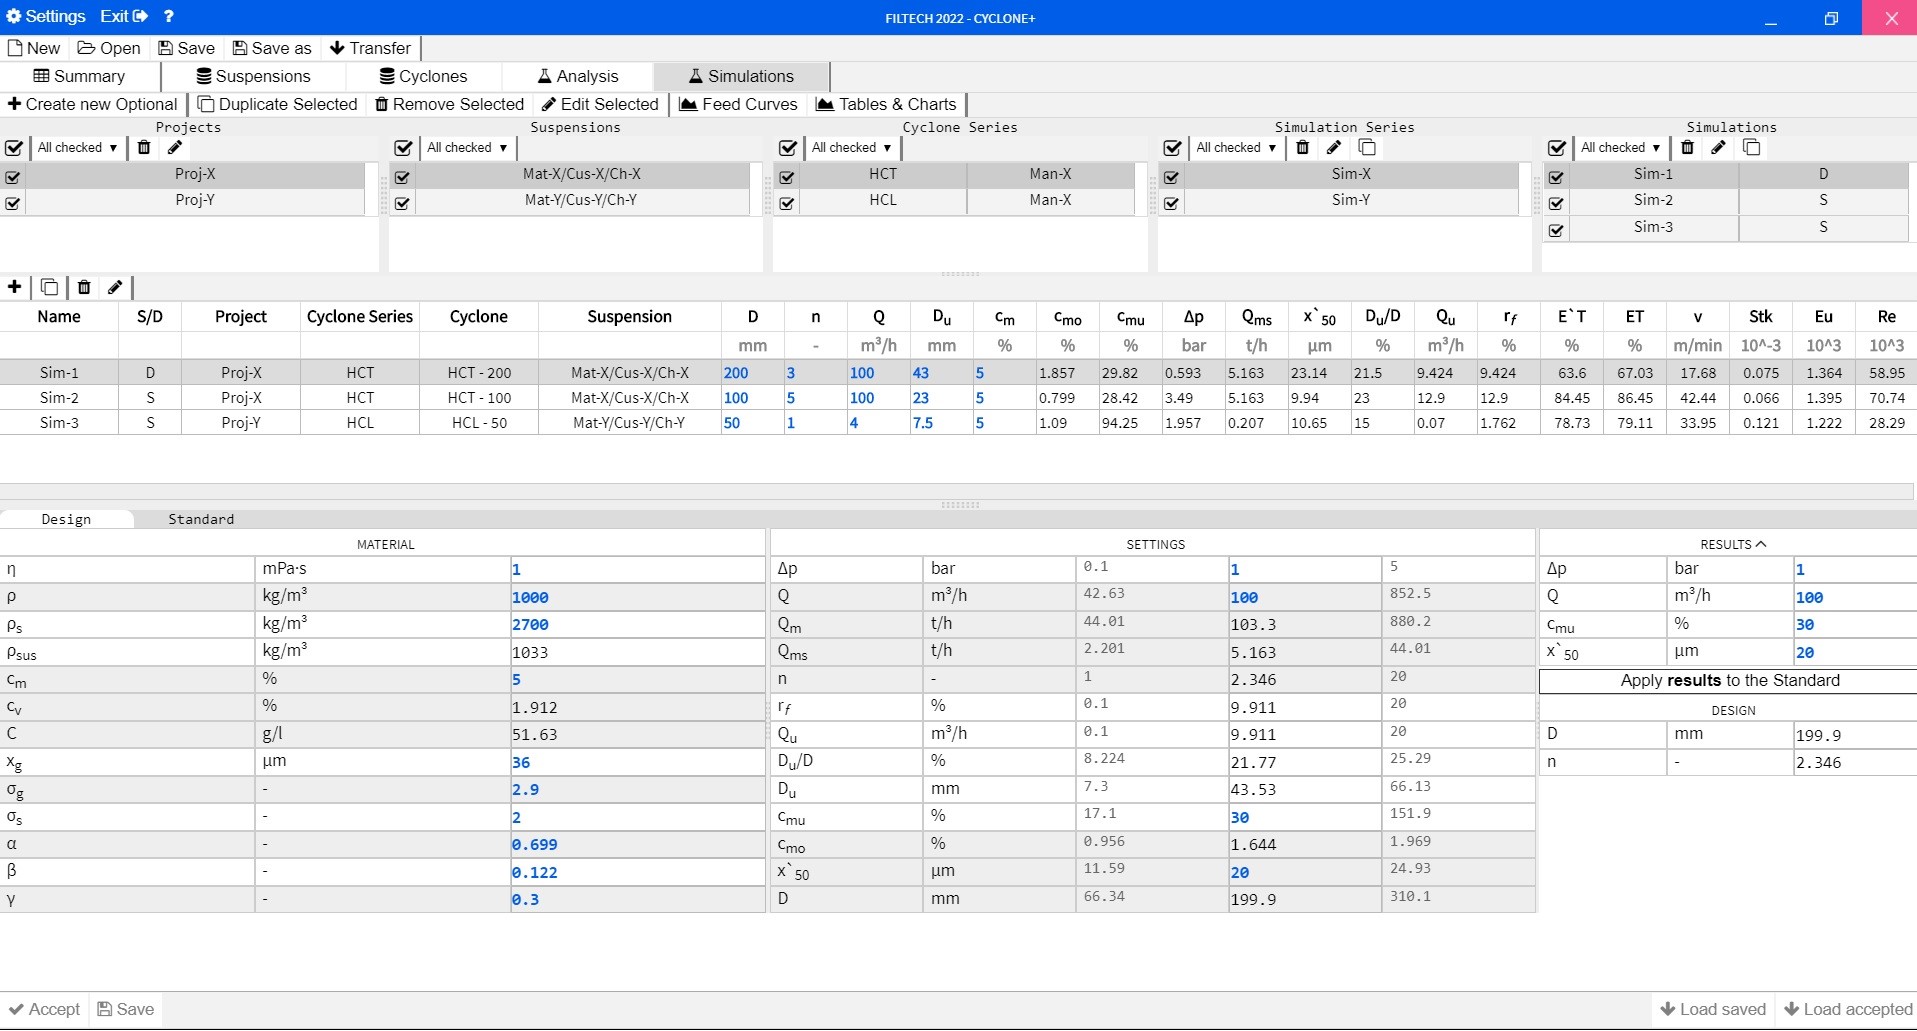
Design option of the Simulation module
Design option of the Simulation module
The Design simulation option enables by default the calculation of the diameter and number of cyclones in parallel connection as well as the underflow (apex) diameter for a given performance of the cyclone unit. For the Design simulation option, we have in the settings field four groups of parameters. In the above example the pressure drop (δp), the feed volume flow rate (Q), the underflow solids mass fraction (cmu) and the cut size (x’50) are given. Please notice that the design option is also a standard calculation option because it allows also the input of the diameter (D) and the number of cyclones (n) and another two parameters in the other two groups.
The calculated cyclone diameter and number of cyclones in the Design option are theoretical values. These values are taken to the Standard option of the Design simulation and there, a realistic diameter of the selected cyclone series closed to the calculated diameter can be chosen. Furthermore, an integer value for the number of cyclones is entered. With realistic values for cyclone diameter and number of cyclones, we have a calculation of the performance unit for these selected realistic values.
3/7
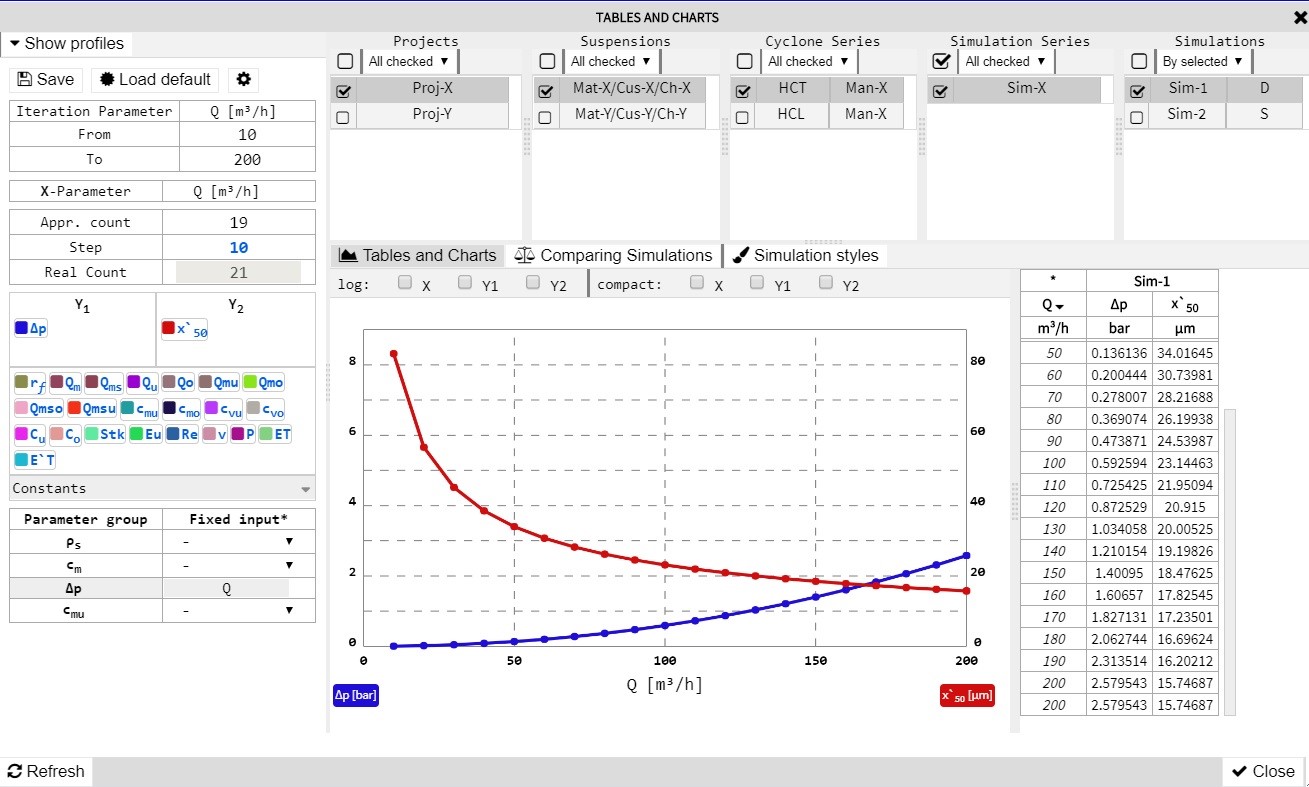
Tables & Charts window for the Simulation module
Tables & Charts window for the Simulation module
In the Tables & Charts window of the simulation module, the influence of any material, geometrical and setting parameter on the result parameters is calculated and displayed in form of tables and graphs. There is a sorting of the parameters, which are changing with the variation of the selected iteration parameter and those, which remain constant. For the diagrams, templates can be saved.
More than one simulation can be selected enabling the comparison of simulation results for different cyclones, different suspensions and different settings.
Tables and diagrams can be copied and pasted in other applications like Word and Excel and can be used for the report and for further data processing.
4/7
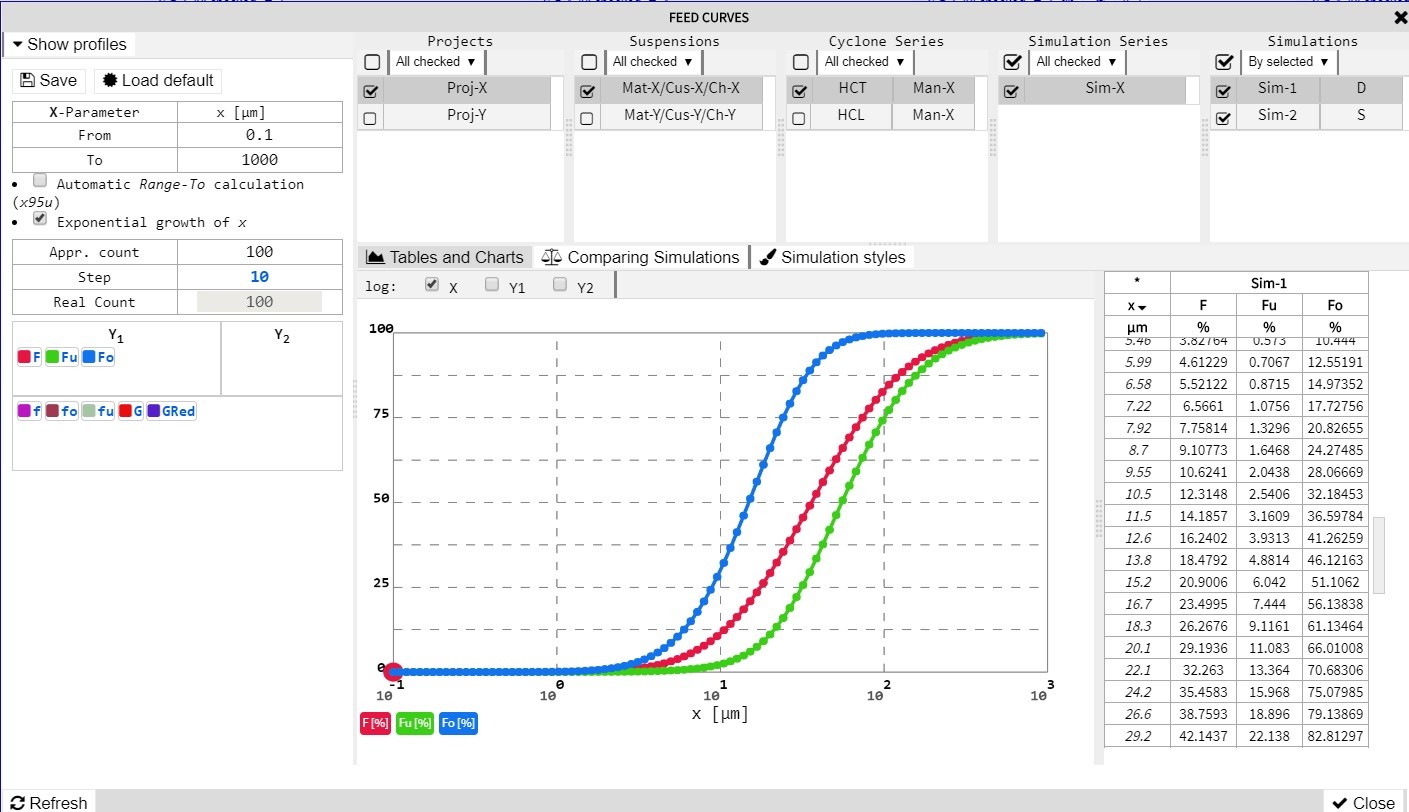
Particle size distribution by mass for the feed, the overflow and the underflow
Particle size distribution by mass for the feed, the overflow and the underflow
For every simulation the particle size distribution my mass for the overflow and the underflow is calculated and in an extra window can be displayed together with the particle size distribution of the feed in form of table and graph.
Furthermore, the Grade efficiency and the reduced Grade efficiency cures are calculated and can be displayed in this window.
5/7
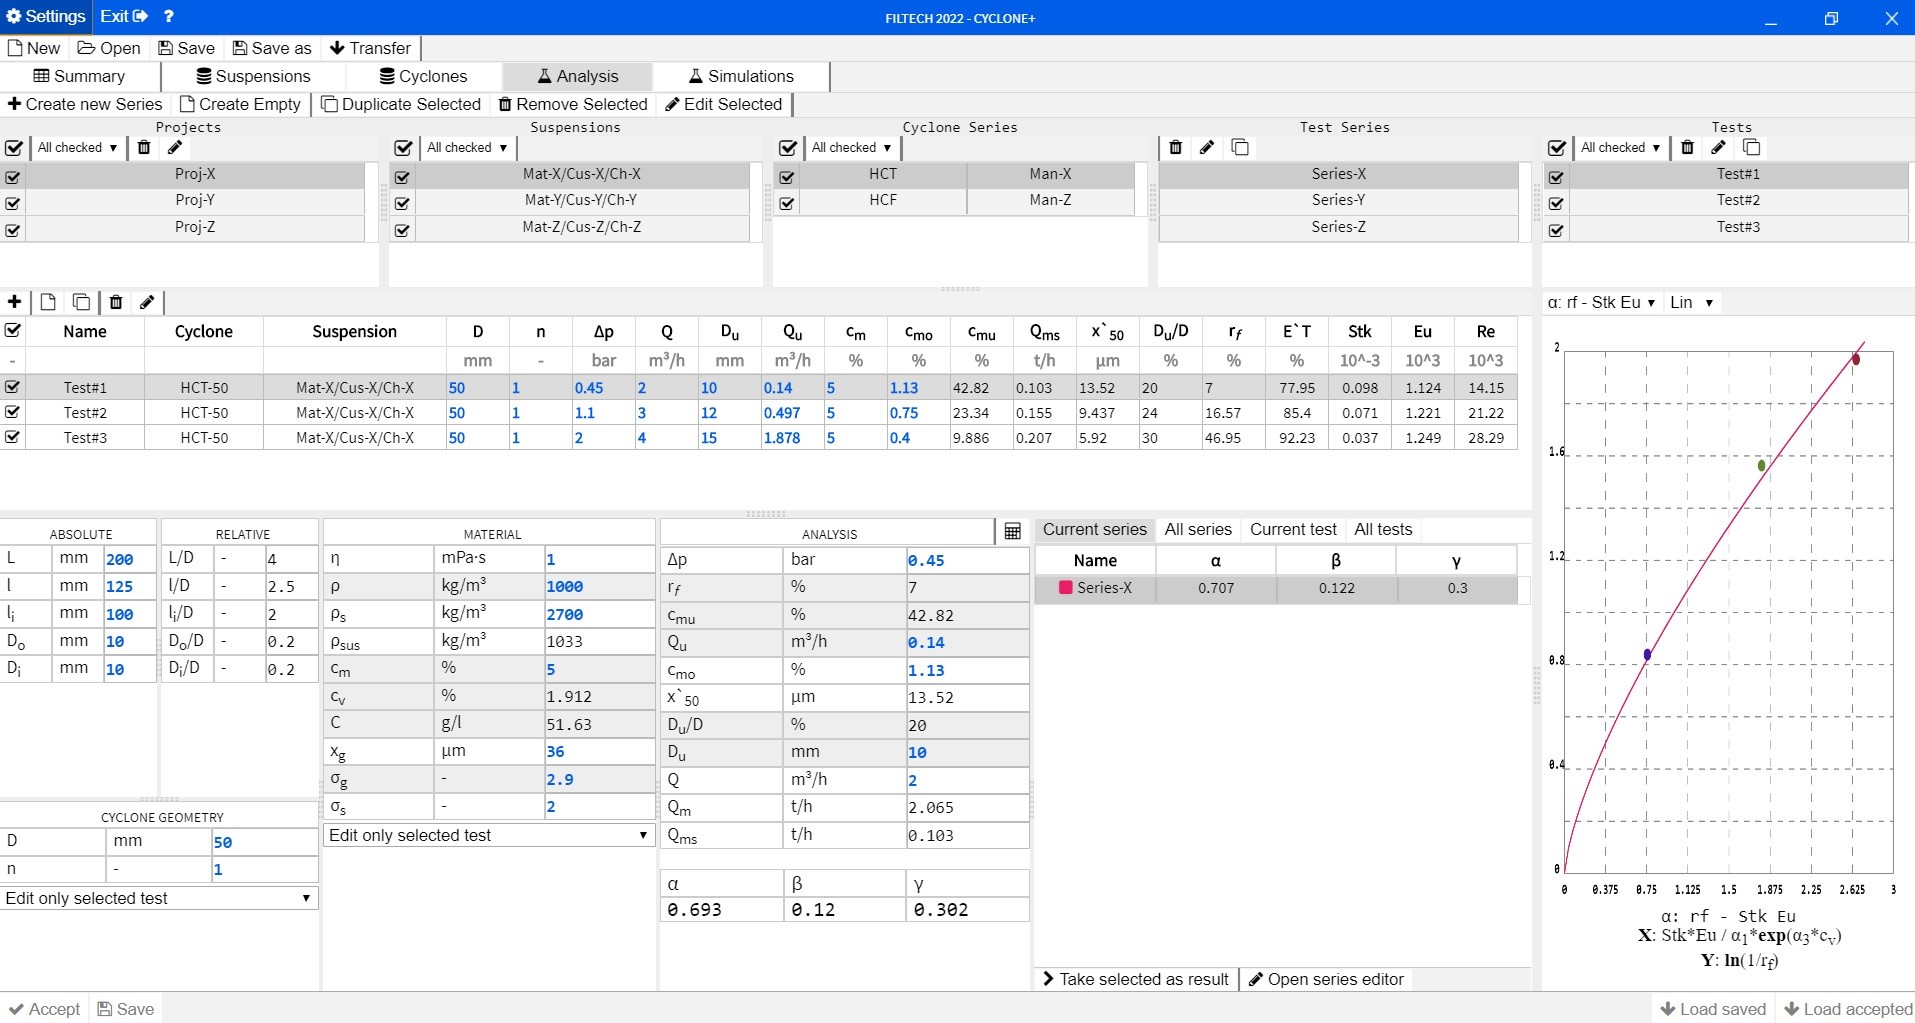
Main window of the Analysis module
Main window of the Analysis module
CyclonPlus enables the input of measured data with a definite cyclone unit in any scale and the analysis of these data based on the used mathematical model. Main task of the analysis module is the judgment of the quality of the tests and the reliable determination of the model adaptation parameters: α, β, γ. These parameters are needed for the simulation module.
The analysis results are taken to the suspension database and can be loaded for the simulation of the performance of any cyclone units belonging to the cyclone series of the tested cyclone(s).
The analysis results (adaptation parameters) of more than one test series can be displayed also in graphical form enabling a user-friendly comparison.
6/7
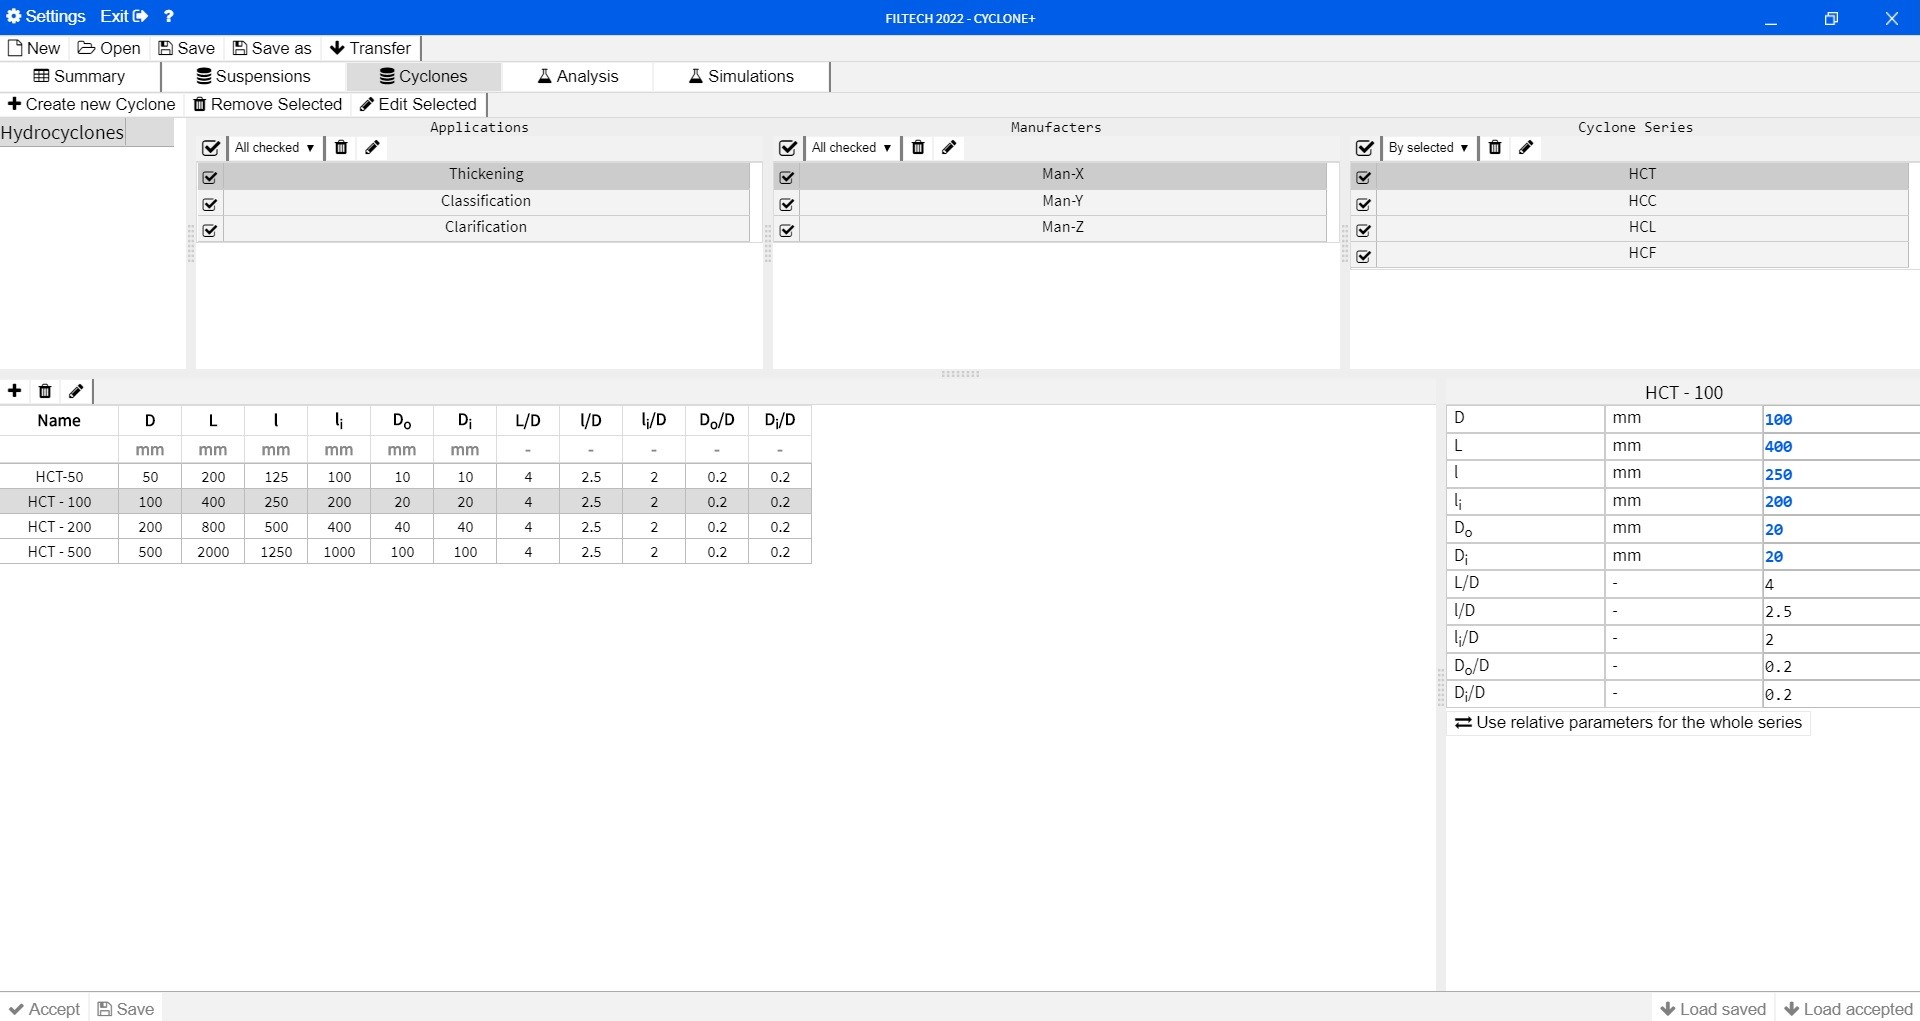
Database window for the Hydrocyclones
Database window for the Hydrocyclones
All-important geometrical parameters of hydrocyclones can be entered and saved in a user-friendly way. Each cyclone belongs to a definite cyclone series and each series to a definite manufacturer and definite application. Name and geometrical parameters of the selected cyclone series are displayed in a table with increasing diameter.
The cyclones data saved in the database are available for the analysis and the simulation modules in the windows “Create new Simulation” and “Create new Test Series”.
7/7
Database window for the Suspensions
Database window for the Suspensions
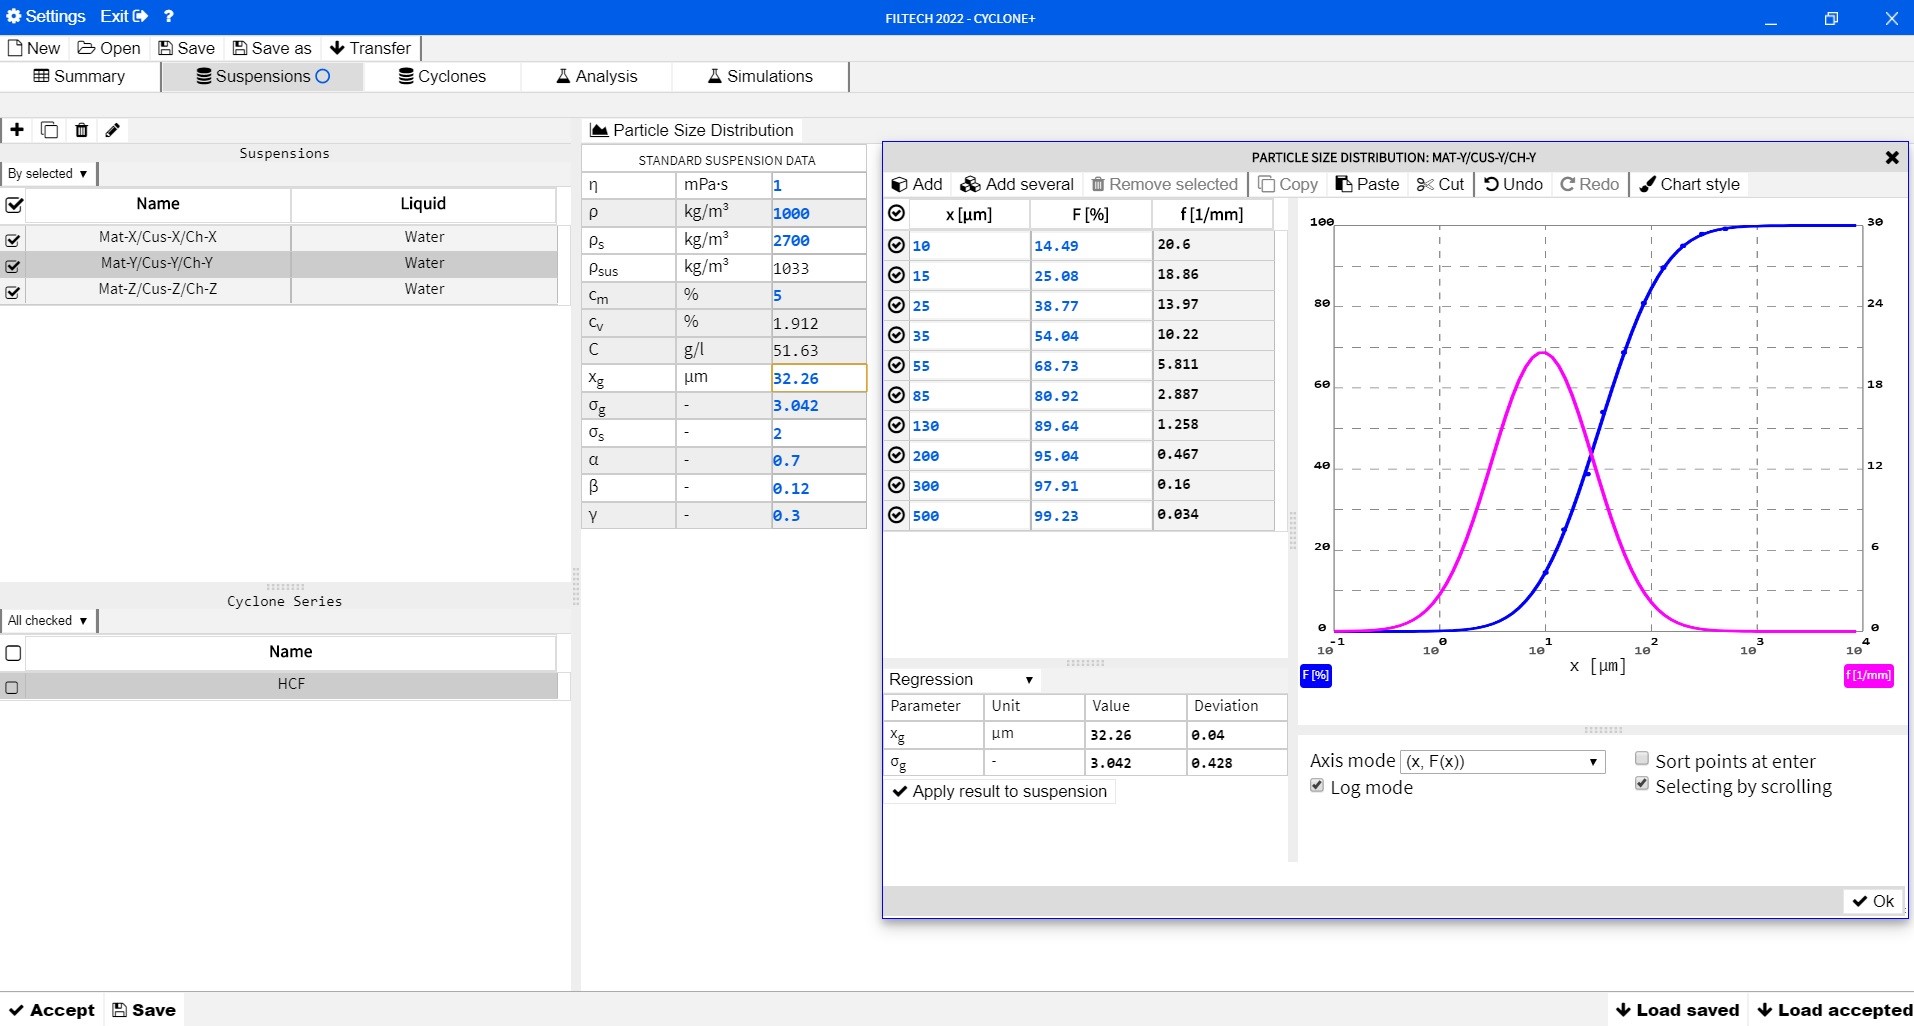
Every suspension, which is used for the Analysis and the Simulation modules, has to be first entered in the suspension database window. Each suspension is characterized by three names: material, customer and charge name and by values for the numerical parameters. These parameters are the viscosity and density of the liquid, the solids density, the solids content in the suspension (feed) as well as the mean particle size and the standard geometric deviation. The last four parameters: standard geometric deviation of the grade efficiency curve and the adaptation parameters α, β, γ are specific for the combination of suspension and the cyclone series of the tested hydrocyclone unit. The adaptation parameters α, β, γ are needed only for the Simulation module and are determined in the Analysis module from the analysis of test data.
The suspension data are available for the analysis and the simulation modules in the windows “Create new Simulation” and “Create new Test Series”. In the Particle Size Distribution window, we can enter measurements of the particle size distribution and the mean particle size and the standard deviation are determined by a regression analysis.